


Carbon emissions from importing and exporting activities in global trade are a common scenario. Many countries face this due to changes in the social and economic factors of a country. With the rise in these factors and global trade, the likelihood of carbon emissions also increases.
India’s carbon emissions released from international trade increased in the past 2 decades. Where India as a Southeast Asian country is increasing its influence in the world with its robust state of global trade, the impact on its environment and countries trading with India, are at cost.
What Is Carbon Emissions In Global Trade?
Carbon emissions are commonly referred to as greenhouse gas (GHG) emissions, which are ‘embodied’ through importing and exporting between countries. Be notified here that GHG emissions consist of different toxic gases, among which carbon dioxide (CO2) tops the chart.
The propellers of these GHG emissions are factors such as production, consumption, domestic demand, and transportation. A World Trade Organisation report explains that there are different determinants of international carbon emissions. This ‘embodied’ carbon emission in trade is determined mainly by these factors:
- The dimension/growth of larger economies,
- The sectoral composition of the trade flows,
- The growth of global value chains (GVCs),
- The whole participation of transportation,
- And the energy efficiency of a system.
To determine the country as a “net importer” or “net exporter”, two of these factors/perspectives must be taken into account, i.e., production and consumption. Production consists of importing raw materials, production of goods and services to consume domestically and export globally. Consumption consists of domestic demand, the consumption of goods and services domestically, and importing from other countries.
This brings the trade balance of GHG emissions embedded in trade between countries, helping in identifying which countries are the net importers of GHG emissions and which are exporters. In layperson terms, the country accounting for the highest amount of emission during the final exports is the net importer, while the country accounting for the highest emissions in importing the commodities for consumption purposes is the net exporter for embodied emissions in trade.
The Highest Carbon Emitted-Products
In India, with the introduction of trade liberalization in 1991, the intensity of the water and air pollution in the country has substantially increased, as per a North Carolina University study. This was mainly due to the increase in production domestically to propel economic growth.
India’s major sources of GHG emissions were from land-use change accounting for 27% of emissions and agricultural production accounts for 22% of emissions, according to the study published in Science.org.
The study highlighted that India’s carbon emissions increased by 39% during the time period 2004-2017. Agricultural commodities such as cereals-including rice, wheat, maize with other grains, and oils such as soybean, palm, and other oil seeds accounted for 45-54% of emissions.
However, on the other hand, animal commodities such as cattle, sheep, swine, chicken, and raw milk accounted for 14-19% of emissions. Vegetables and fruits accounted for even less than 8%. The import data of the above-mentioned and hereby highlighted commodities is below.
India Import Export Data 2022
India import data represented below features the imported commodities of agriculture from the names mentioned above for the time period spanning from the first quarter of 2021 to the first quarter of 2022.
The featured list contains the commodities also on the basis of data available as per India’s import status for the said commodity. For example – India is not a wheat importer, but it exports wheat in large quantities, while the opposite goes for the trade of palm oil by India.
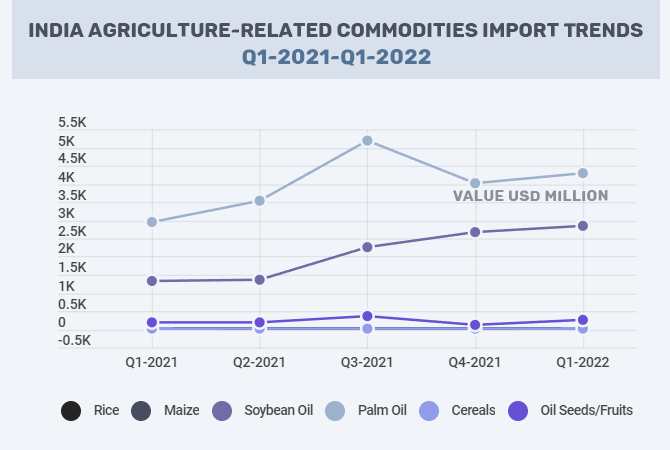
Among all the commodities, “cereals” and “oil seeds/fruits” are based on the HS Code classification of Chapters (2-digit). Rest are based on the HS Code classification of Headings (4-digit).
Read More: India’s Bilateral Trade – FTAs with Australia, US, UK, and UAE in 2022
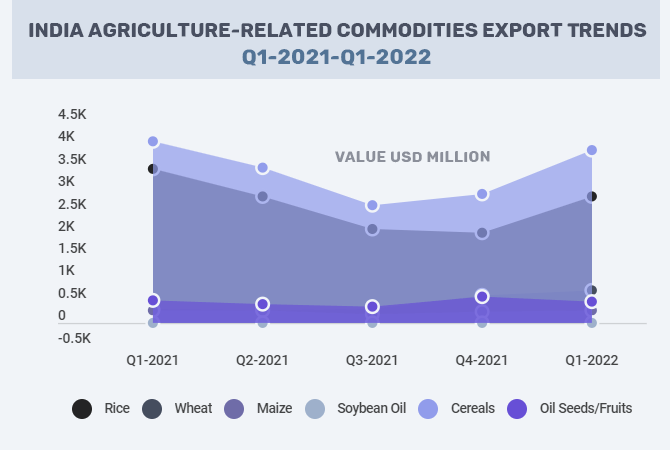
India export data represented below features the exported commodities of agriculture from the names mentioned above for the time period spanning from the first quarter of 2021 to the first quarter of 2022.
The featured list contains the commodities also on the basis of data available as per India’s export status for the said commodity. For example – India is not a palm oil exporter, but it imports palm oil in significant amounts, while the opposite goes for the wheat trade in India.
Read More: Egypt Approves India For Wheat Imports Of About 1 Million Tons
Among all the commodities, “cereals” and “oil seeds/fruits” are based on the HS Code classification of Chapters (2-digit). Rest are based on the HS Code classification of Headings (4-digit).
The below represented India import data features the list of animal commodities as aforementioned with their corresponding import values for a specific time period. The taken time period spans from the first quarter of 2021 to the first quarter of 2022.
India export data 2022 shown below lists the commodities on the basis of their availability and export status/trend from India. The exports of cattle and swine are almost non-existent in virtual datasets in terms of both quantity and amount/export value. Hence, these two commodities are not in the below India trade data representation.
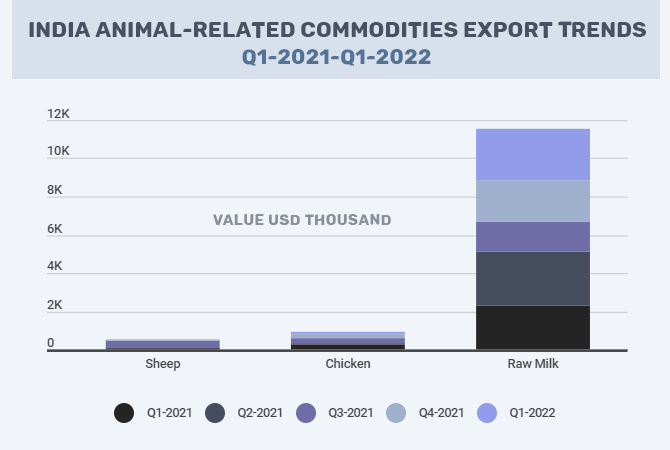
Among all the shown commodities, the agricultural-related commodities are most likely to create carbon emissions due to their high values of exports, implying that India is a net importer of GHG emissions. The animal-related commodities are on the lower side of the exports from India when compared to the exports of agricultural commodities.
However, as earlier mentioned that vegetables and fruits accounted for less than animal commodities in carbon emissions, this might contradict the earlier said statement. The final conclusion is on the basis of taking into consideration which commodities’ values are higher.
How Can We Control GHG Emissions?
The monitoring of GHG emissions is one of the basic yet crucial steps to control the harmful gases released into the environment. GHG emissions embedded in the exchange of goods and services between countries, as aforementioned, can be traced back to what activities exactly contribute to the release of greenhouse gases.
Center For Climate And Energy Solutions (C2ES) highlights the different sources of greenhouse gas emissions and the percentage each accounts for the contribution of GHG emissions. The primary sources of emissions come from electricity and heat (31%) and transportation (15%). Manufacturing and construction (12.4%) and fuel combustion (8.4%) are other sources.
The secondary sources consist of different specific activities contributing to the GHG emissions, which include bunker fuels (2.2%), waste (3%), land-use change (6%), industrial process (6%) and agricultural activities (11%). Energy production accounts for the highest percentage of all activities listed here, with a 72% percentile.
Read More: Trade and Environment: Hand-In-Hand For A Sustainable Future
Societal factors come into play the highest in controlling the emissions since the consumer demand is the one-single root for all the sources listed here. The demand for climate-friendly goods and services can foremost contribute to lower emissions.
Transportation development involving alternative means of transportation that contributes to lesser carbon emissions can be put to good use. Implementation of sustainable policies works out in the long run.
International Energy Agency (IEA) also highlights in World Energy Outlook 2021 that clean energy technologies and methods have the potential to bring a major reduction in GHG emissions and in the energy trade patterns, largely incorporating fossil fuels.
Read More: How Ukraine’s Clean Energy Market Is Valuable To Russia and the EU?
The new technologies and alternative energy sources such as solar panels, wind turbines, EVs (Electric Vehicles) batteries and grid lines are 5-15% more expensive than the carbon emitted sources such as fossil fuels, as per the report.
This comes across as a challenge, but these new technologies and alternative energy are relatively more efficient than fossil fuels or other sources of energy emitting GHG emissions. Clean energy transitions as a part of the ‘energy trade’ can bring a major change in trade patterns of global energy sources.
Recommendations:
Global Discussion On Agri-Products Trade At UKCOP26 Conference
US Sanction The Extension On PV Cells For Fewer CO2 Footprints
Electric Vehicles Demand Is Going Up And Likely To Grow More
Coal and Global Warming: A Study On Coal Trade and Its Effect

