

The US, one of the key players in world trade across the regions, has overridden Qatar and Australia to secure the top position as the global supplier of LNG. The significant rise in the export of LNG from the USA demonstrates the shift in the demand for energy from crude oil to sustainable sources of energy.
The shift is majorly attributed to the growing concern of climate change and global warming which is forcing nations to adopt more efficient and eco-friendly sources. Further, with accelerated demand for making the country carbon neutral, the national and international Govt are diversifying their source of energy toward environment-friendly LNG. Let’s understand how USA LNG exports cover the international market.
US LNG Export to Top Partners
The export of LNG from the USA increased despite the worldwide lockdown due to the pandemic, geo-political tension, and slower demand due to the inflated market.
The analysis of the demand pattern for LNG from 2019 to 2023, reveals export of LNG increased by USD 24.7 billion, and the export to the Netherlands soared by 854.3% in the same year. From 2022 to 2023, the demand from the major economies decreased due to stagnant growth and technical recession, for instance, Spain, France, and the UK showed a decline of 54.2%, 45.4%, and 41.3% respectively in import value of LNG from the USA.
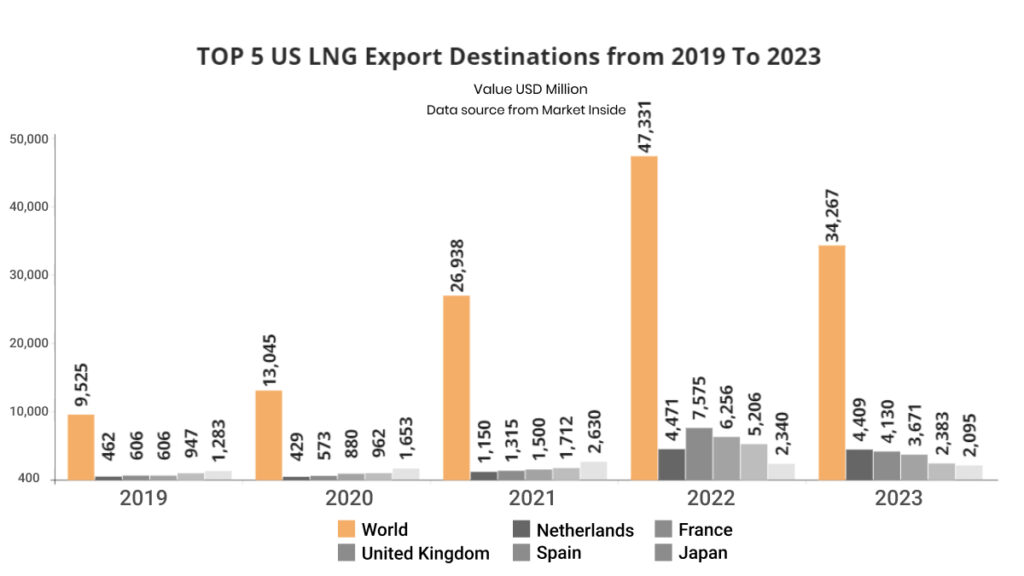
| Countries | 2019 | 2020 | 2021 | 2022 | 2023 |
| World | 9525 | 13045 | 26938 | 47331 | 34267 |
| Netherlands | 462 | 429 | 1150 | 4471 | 4409 |
| France | 606 | 573 | 1315 | 7575 | 4130 |
| United Kingdom | 606 | 880 | 1500 | 6256 | 3671 |
| Spain | 947 | 962 | 1712 | 5206 | 2383 |
| Japan | 1283 | 1653 | 2630 | 2340 | 2095 |
***Value USD Million
US LNG Export to EU and Asia
EU and Asia are the world’s busiest trade continents as both are strategically important for global trade perspective. EU, with high expenditure power, and Asia with two out of five world’s largest economies along with half of the world’s population create a huge market space for newly emerging technologies and products.
Considering this exponential growth of LNG in EU and the Asia, exporters from the USA are expanding their business in these countries. For instance, the US export of LNG to the EU and Asia increased by 114% and 259% respectively from 2019 to 2021. This export trend changed from 2021 to 2023. The US export to the EU increased by 174.7% whereas it declined with Asia by 33.1%. This fluctuation of trade presents the changing market direction from Asia to the EU and sheds light on other emerging partners’ LNG suppliers.

| Year | US LNG Export to EU | US LNG Export to Asia |
| 2019 | 3,014 | 4,036 |
| 2020 | 3,267 | 7,292 |
| 2021 | 6,464 | 14,500 |
| 2022 | 25,256 | 12,560 |
| 2023 | 17,759 | 9,689 |
***Value Million USD
US LNG Export to Asia By Countries
The demand for sustainable sources of energy in Asia continuously increasing year-on-year, as both China, India, and Japan are working on their plan to make the country carbon neutral within their targeted time frame. To take advantage of this vast market, exporters from the USA see Asia as an export opportunity.
For instance, Japan is the largest buyer of US LNG in Asia with more than USD 2 billion in 2023, despite being the largest buyer, the trade with Japan declined from 2634 million in 2021 to USD 2095 million in 2023. This decline is not only with Japan but follows with all the top partners in Asia. This decline is attributed to ongoing geopolitical challenges, global slowdowns, and other factors.

| Countries | 2019 | 2020 | 2021 | 2022 | 2023 |
| Japan | 1283 | 1653 | 2634 | 2340 | 2095 |
| South Korea | 1303 | 1706 | 3425 | 3190 | 1963 |
| China | 61 | 1260 | 3561 | 1338 | 1716 |
| Turkey | 177 | 661 | 1459 | 1803 | 1045 |
| India | 473 | 733 | 1367 | 1284 | 945 |
***Value Million USD
Why Did LNG Exports Decline In 2023?
- Global Recession –
The world’s powerful economies are struggling to sustain their pre-COVID growth, for instance, the UK and Japan are under a technical recession, resulting in a decline in worldwide demand.
- Supply Chain Disruption –
Continuous attacks in the red-sea area, and conflict between nations, hampered the supply chain across the world, increasing the price to new heights.
- Emerging Markets –
The rise of renewable energy sources, like wind, solar, thermal power, etc. is narrowing down the market size for traditional fuel.
To sustain the growth of LNG exporters from the USA, it becomes crucial for both Govt and the businesses to work collaboratively with proper implementation of policies, and explore the new potential sites for LGN resources. Businesses from the USA and the world can invest in this niche market for lasting growth.

