


The European Union (EU), the world’s largest trading block consisting of 27 countries, and China, the world’s 2nd largest economy with a global manufacturing powerhouse, are failing on the economic front to sustain bilateral trade for both export and import businesses. China and the EU dominated the export market worldwide, with more than 17% and 13% respectively.
Recently, a report was published that unveiled deteriorating bilateral trade relations between China and the EU. According to the report, there is a sharp 27% decline in the trade deficit in 2023 from 2022. It also revealed that EU overall exports to China decreased by 3% and imports by 17%. The narrowing of the trade deficit between China and the EU brings two sides of the same coin.
First, it prepares the concrete plinth for businesses from both China and the EU to diversify the supply network with new emerging markets.
Second, the narrowing of the deficit boosts market confidence for further expansion.
To consider this, let’s understand the pattern of demand and supply of commodities with the last five trends.
The total market size of EU exports to China from 2019 to 2023 increased by USD 29 billion, and imports from China soared by USD 135 billion in the same year. This humongous trade value turned into a trade deficit from 2021 to 2023, for instance, exports and imports declined by USD 28 and 17 billion, respectively.
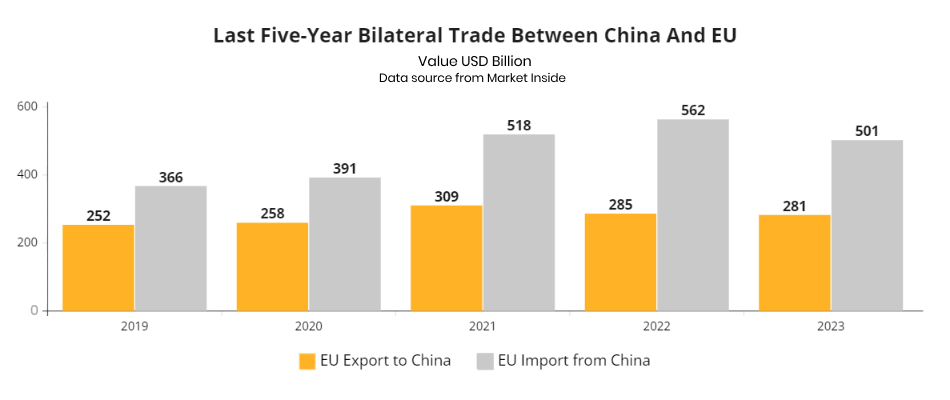
| Year | EU Export to China | EU Import from China |
| 2019 | 252 | 366 |
| 2020 | 258 | 391 |
| 2021 | 309 | 518 |
| 2022 | 285 | 562 |
| 2023 | 281 | 501 |
***Value USD Billion
EU’s Top Economies Trade with China
From the above table, it’s clear that bilateral trade relations between China and the EU are struggling to sustain growth. Top economies like Germany, the Netherlands, Italy, and France can look at the Chinese market for export and import goods. If you observe.
From 2019 to 2023, Germany and the Netherlands were the only top countries in the EU whose imported commodities increased and touched the mark of USD 100 billion, whereas France and Italy witnessed a decline in trade. The steepest rise in imports was observed in Germany and the Netherlands, with 63 and 67 billion USD, respectively, from 2022 to 2023. And it drastically fell with Italy and France by 58 & 75 billion USD from 2019 to 2023.
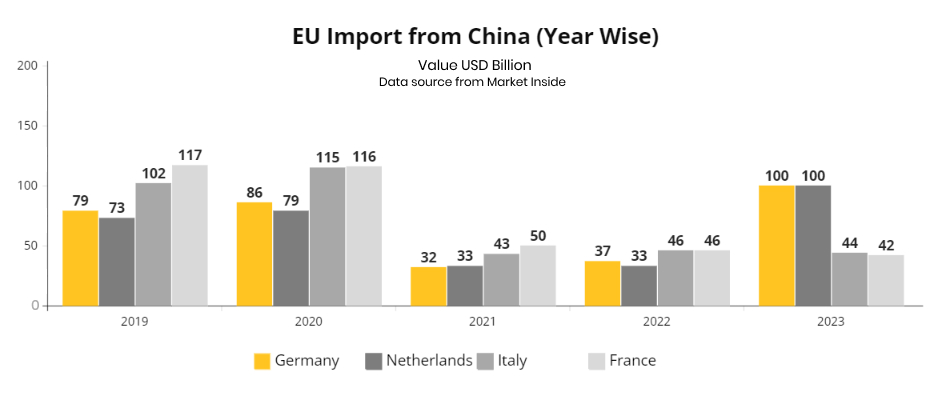
| Year | Germany | Netherlands | Italy | France |
| 2019 | 79 | 73 | 102 | 117 |
| 2020 | 86 | 79 | 115 | 116 |
| 2021 | 32 | 33 | 43 | 50 |
| 2022 | 37 | 33 | 46 | 46 |
| 2023 | 100 | 100 | 44 | 42 |
***Value USD Billion
China’s exports to the top economy of the EU show both upward and downward trends by comparing the data from the last five years. Now, understand the amount of goods exported to China from the EU’s top economies.
The table below states Germany became the only country whose exports to China remained above $100 billion from 2019 to 2023, defeating all global challenges. However, Germany’s exports declined from 111 billion in 2022 to 106 billion in 2023. Commodities exported to China by France, Italy, Ireland, and the Netherlands increased after 2022 except Germany. This shows potential business opportunities with China.
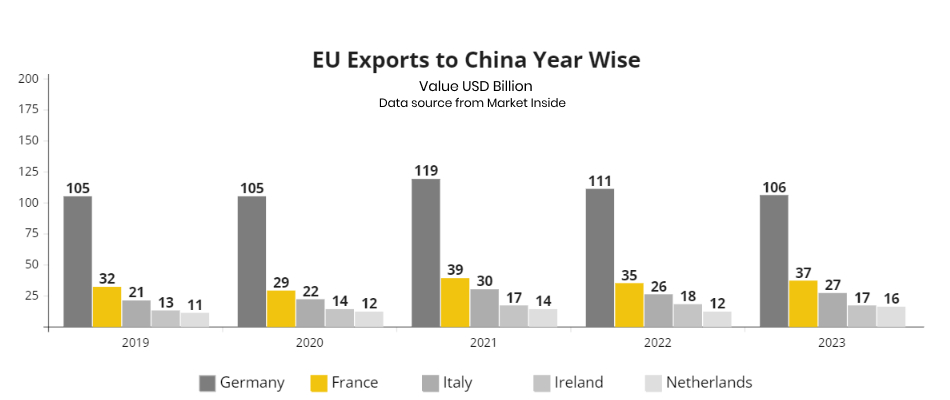
| Year | 2019 | 2020 | 2021 | 2022 | 2023 |
| Germany | 105 | 105 | 119 | 111 | 106 |
| France | 32 | 29 | 39 | 35 | 37 |
| Italy | 21 | 22 | 30 | 26 | 27 |
| Ireland | 13 | 14 | 17 | 18 | 17 |
| Netherlands | 11 | 12 | 14 | 12 | 16 |
***Value USD Billion
Until now, you have a fair idea of the bilateral trade between China & the EU, along with the top trading partners for both exports and imports. We will now explore the top commodities exported and imported by each other with the last two years’ trends.
Export and Import of Top Commodities
Analysing the last two years’ trends shows exports of motor cars & other vehicles from Europe to China increased from USD 5392 million in Q2 of 2022 to USD 5493 in Q4 of 2023. Vaccines for human medicine increased twofold from Q1 of 2022 to Q4 of 2023 while the export of machines & apparatus for semiconductor devices increased by threefold. For complete insight, refer to the below table.
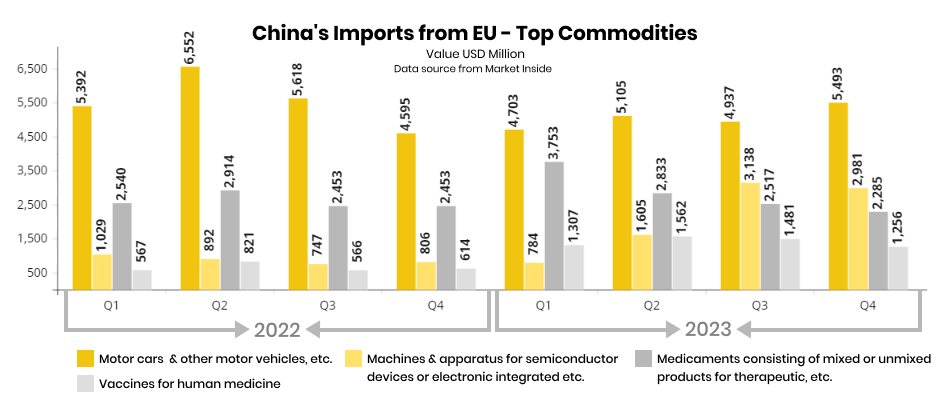
| Year | 2023 | |||||||
| 2022 | ||||||||
| Q1 | Q2 | Q3 | Q4 | Q1 | Q2 | Q3 | Q4 | |
| Motor cars & other motor vehicles, etc. | 5392 | 6552 | 5618 | 4595 | 4703 | 5105 | 4937 | 5493 |
| Machines & apparatus for semiconductor devices or electronic integrated etc. | 1029 | 892 | 747 | 806 | 784 | 1605 | 3138 | 2981 |
| Medicaments consisting of mixed or unmixed products for therapeutic, etc. | 2540 | 2914 | 2453 | 2453 | 3753 | 2833 | 2517 | 2285 |
| Vaccines for human medicine | 567 | 821 | 566 | 614 | 1307 | 1562 | 1481 | 1256 |
***Value USD Million
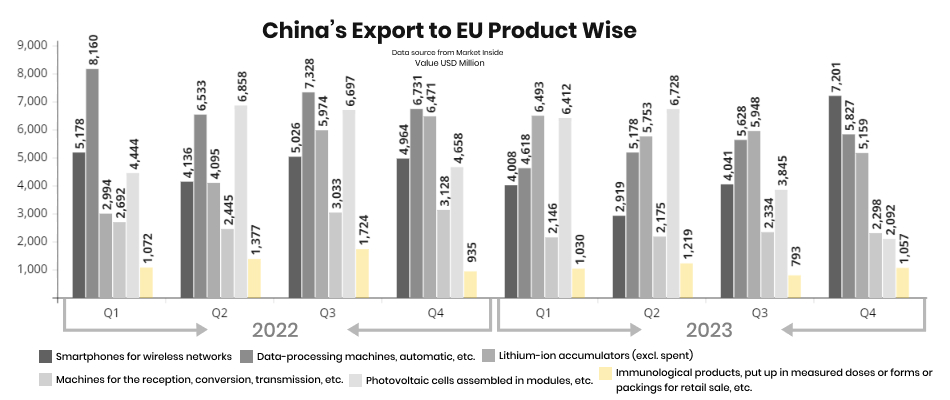
China’s top most exported commodities to Europe from Q1 of 2022 to Q4 of 2023 increased for some commodities and, at the same time, decreased for others. From 2022 to 2023, the export value for smartphones and wireless networks decreased by $1142 million from the previous year but drastically increased after Q2 of 2023 to Q4 of 2023. There is a trade deficit of USD 7.5 billion worth of data processing machines, etc. from Q1 of 2022 to Q4 of 2023. For comprehensive insights, look at the table.
| Product Name | 2022 | 2023 | ||||||
| Q1 | Q2 | Q3 | Q4 | Q1 | Q2 | Q3 | Q4 | |
| Smartphones for wireless networks | 5178 | 4136 | 5026 | 4964 | 4008 | 2919 | 4041 | 7201 |
| Data-processing machines, automatic, etc. | 8160 | 6533 | 7328 | 6731 | 4618 | 5178 | 5628 | 5827 |
| Lithium-ion accumulators (excl. spent) | 2994 | 4095 | 5974 | 6471 | 6493 | 5753 | 5948 | 5159 |
| Machines for the reception, conversion, transmission, etc. | 2692 | 2445 | 3033 | 3128 | 2146 | 2175 | 2334 | 2298 |
| Photovoltaic cells assembled in modules, etc. | 4444 | 6858 | 6697 | 4658 | 6412 | 6728 | 3845 | 2092 |
| Immunological products, put up in measured doses or forms or packings for retail sale, etc. | 1072 | 1377 | 1724 | 935 | 1030 | 1219 | 793 | 1057 |
***Value USD Million
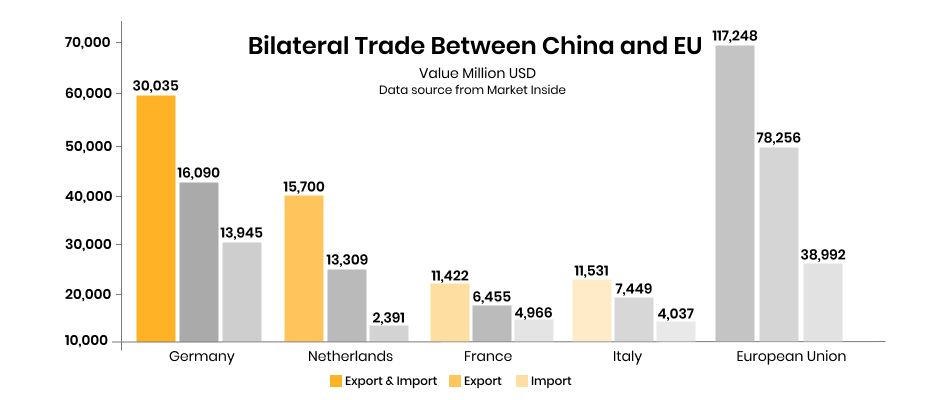
At the start of 2024, Bilateral trade between China and the EU fell by -4.1%, the steepest decline observed in the import business, which is more than -9.4%. Among the EU, imports to Germany fell more than -18%, whereas imports from the Netherlands increased by 26%. For a comprehensive view, look at the table.
| EU and Top Trading Countries | Export & Import | Export | Import |
| Germany | 30035 | 16090 | 13945 |
| Netherlands | 15700 | 13309 | 2391 |
| France | 11422 | 6455 | 4966 |
| Italy | 11531 | 7494 | 4037 |
| European Union | 117248 | 78256 | 38992 |
***Value Million USD
How Does Strengthening Bilateral Trade Boost Businesses?
- Greater Market Access
Any development in trade relations would open the door for global markets. Companies take advantage of both the high spending power of the EU and the market of 1.4 billion people.
- Sustainable Supply Chain Management
Close cooperation will provide efficient and cost-effective supply chain management across the globe, as both China and the EU cover more than 30% of the export market globally.
- Innovation and Technology Transfer
Well-framed economic ties between China and the EU will help foster the growth of business through potential collaboration in research and development.
- Strengthen the World Economy
Improving trade activity will stimulate economic growth worldwide. These would benefit all big and small businesses.
- Reduce Trade Barriers
Lower trade barriers from both sides will streamline the smoothest flow of exports and imports of goods. This would help businesses, logistics companies, and others.
The EU and China are the world’s largest exporters of goods covering more than 17% of the export market. Sustainable growth, lasting revenue, and free flow of supply networks require a constructive economic policy for businesses.

