
Global Rubber Market Overview
Rubber is one of the world’s most strategically critical raw materials. Whether you call it natural rubber, synthetic rubber, or simply look it up under rubber trade data. The global rubber market covers every sector of the modern economy. From the tyres rolling on highways to the surgical gloves in operating theatres, the seals inside jet engines, and the cables running through data centers.
The Association of Natural Rubber Producing Countries (ANRPC) estimates that the global rubber market will reach approximately 16 million metric tons annually in 2026.
Rubber trade data is one of the most actionable tools for commodity intelligence. Every shipment of rubber, natural or synthetic, crosses borders under a specific HS Code, generating customs records that reveal exactly who is buying, who is selling, at what price, and at what volume. This data is the foundation of a competitive supply chain strategy.
Globally, the rubber supply chain is geographically concentrated and strategically exposed. Asia accounts for nearly 70% of global rubber production. A handful of countries – Thailand, Indonesia, Vietnam, Malaysia, and the Ivory Coast dominate the rubber supply chain. This concentration creates both opportunities and risks for importers worldwide.
Five powerful forces are reshaping the rubber trade in 2026: the electric vehicle revolution drives specialised tyre demand, the EU Deforestation Regulation (EUDR) forces supply chain traceability, a structural natural rubber supply deficit has persisted for multiple years, the expansion of synthetic rubber continues in China and Korea, and growing demand comes from medical and clean energy applications.
Natural Rubber Vs Synthetic Rubber: Understanding the Difference
Before diving into the rubber import export data and statistics, it is essential to understand the two distinct categories that dominate the global rubber trade – each with its own supply chain, HS Code, market dynamics, and price drivers.
Natural Rubber (NR) – HS Code 4001
Natural rubber is derived from the latex sap of the Hevea brasiliensis tree – the rubber tree, which is predominantly grown in tropical Southeast Asia. The latex is harvested through a process called tapping, coagulated, and processed into standard grades such as TSR20 (technically specified rubber, grade 20) and RSS3 (ribber smoked sheet, Grade 3) – the two most actively traded grades on the Singapore Commodity Exchange (SICOM)
Natural rubber is well known for its unmatched elasticity, tensile strength, and fatigue resistance – properties critical for aircraft tyres, heavy–vehicle tyres, and medical-grade latex products that synthetic alternatives can not fully replicate.
Synthetic Rubber ( SR) – HS Code (4002)
Synthetic rubber generally differs from natural rubber, which is manufactured from petroleum derivatives – primarily butadiene and styrene for SBR (Styrene-Butadiene Rubber), and isoprene for IR (isoprene rubber). Major synthetic rubber types traded globally include.
- SBR (Styrene-Butadiene Rubber) – the world’s most produced synthetic rubber, used in passenger car tyres and general-purpose applications.
- EPDM (Ethylene Propylene Diene Monomer) – critical for automotive weatherstripping, roofing membranes, and construction sealing.
- NBR (Polybutadiene Rubber) – dominant in oil-resistant applications, medical gloves, and fuel hoses.
- BR (Polybutadiene Rubber) — used in high-performance tyre sidewalls, conveyor belts, and golf balls.
Synthetic rubber now accounts for approximately 50% of total global rubber production. South Korea, Thailand, the USA, China, Japan, and Vietnam are the major exporters globally.
In trade intelligence, precision isn’t detail – it’s the difference between insight and error. Confusing natural rubber (HS 4001) with synthetic rubber (HS 4002) isn’t a small mistake – it means mixing two entirely different markets, supply chains, and price realities. The smartest analysts don’t just analyse data – they define it correctly first.
HS Codes For Rubber: Your Customs Classification Guide
In a globalised world, where every product is connected across borders and classified under HS codes. All rubber products are classified under HS Chapter 40 – Rubber and Articles thereof. This chapter encompasses everything from raw latex to manufactured tyres. For importers, exporters, and trade data analysts, the most critical codes are.
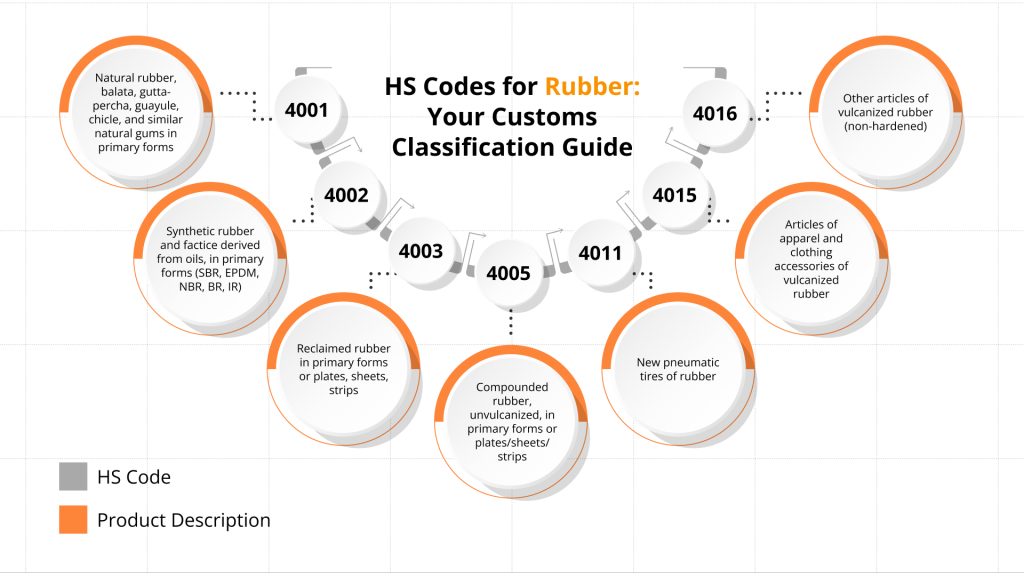
| HS Code | Product Description |
| 4001 | Natural rubber, balata, gutta-percha, guayule, chicle, and similar natural gums in primary forms |
| 4002 | Synthetic rubber and factice derived from oils, in primary forms (SBR, EPDM, NBR, BR, IR) |
| 4003 | Reclaimed rubber in primary forms or plates, sheets, strips |
| 4005 | Compounded rubber, unvulcanized, in primary forms or plates/sheets/strips |
| 4011 | New pneumatic tyres of rubber |
| 4015 | Articles of apparel and clothing accessories of vulcanized rubber |
| 4016 | Other articles of vulcanized rubber (non-hardened) |
Country-specific extension: Beyond the 6-digit international HS Code, countries add national digits. The US uses 10-digit HTS codes, India uses 8-digit ITC-HS Codes, the EU uses 8-10-digit CN/TARIC, and GCC countries upgraded to 12-digit HS Codes from January 2025. When pulling rubber import export data from any national database, always use the appropriate national code extension to ensure accurate product matching.
Top Rubber Exporting Countries – 2024-2025
The global rubber export market is dominated by a mix of natural rubber-producing nations in Asia and synthetic rubber-producing nations, manufacturers in Europe and North America. The table below presents the top 10 rubber-exporting countries by total export value (natural + synthetic combined) for 2024 and 2025, based on customs rubber trade data.
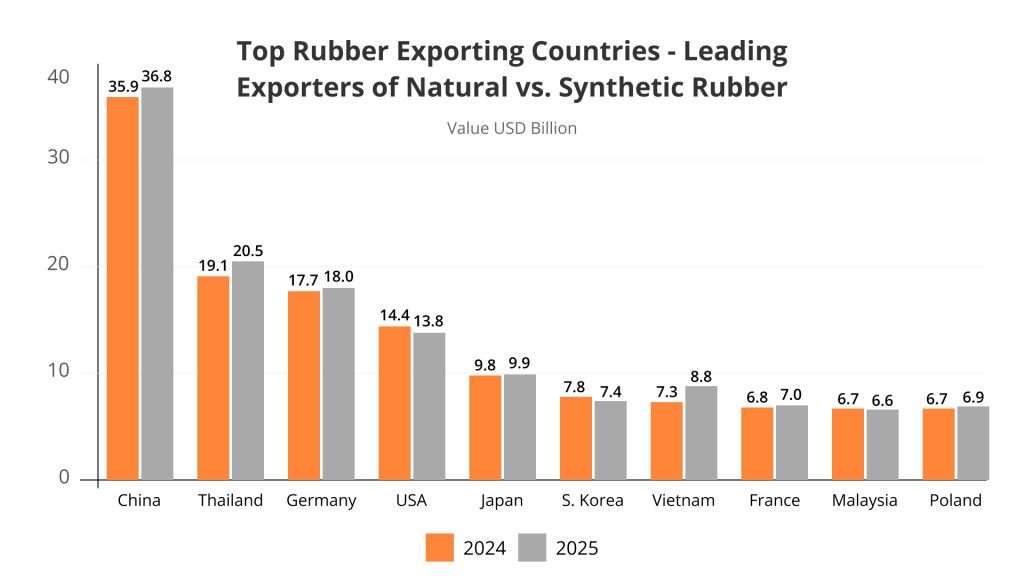
Make a chart: Top Rubber Exporting Countries – Leading Exporters of Natural vs. Synthetic Rubber
| Top Rubber Exporters | 2024 | 2025 |
| China | 35.9 | 36.8 |
| Thailand | 19.1 | 20.5 |
| Germany | 17.7 | 18.0 |
| USA | 14.4 | 13.8 |
| Japan | 9.8 | 9.9 |
| South Korea | 7.8 | 7.4 |
| Vietnam | 7.3 | 8.8 |
| France | 6.8 | 7.0 |
| Malaysia | 6.7 | 6.6 |
| Poland | 6.7 | 6.9 |
Value USD Billion
Top Rubber Importing Countries 2024-2025
The rubber import landscape is shaped by industrial demand from tyre manufacturers, automotive OEMs, medical device producers, and industrial rubber goods manufacturers. The USA remains the world’s largest rubber importer, driven by its enormous tyre market, while China’s import growth of 16.5% in 2025 reflects restocking and expanding domestic manufacturing.
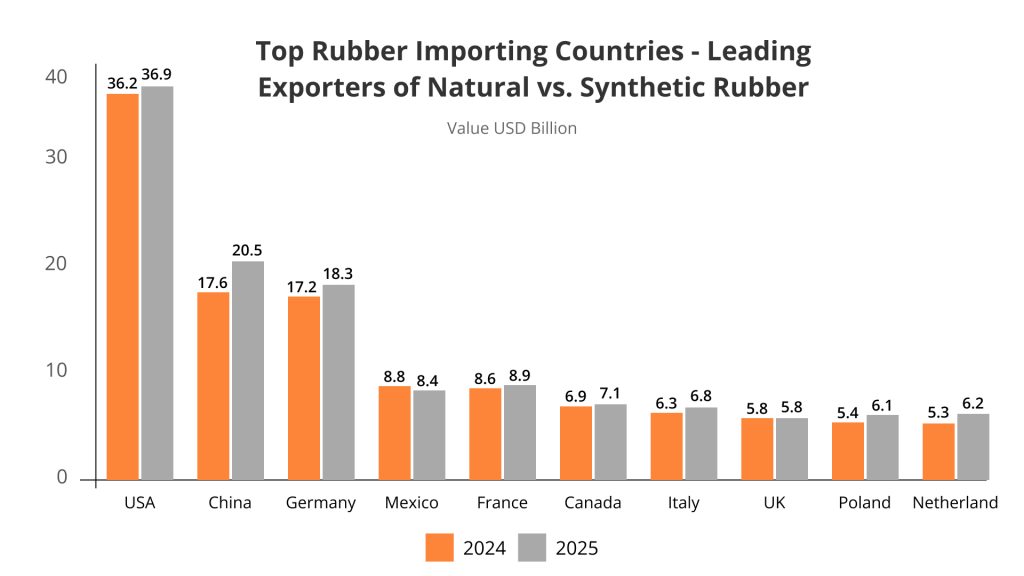
| Rubber Importing Countries | 2024 | 2025 |
| USA | 36.2 | 36.9 |
| China | 17.6 | 20.5 |
| Germany | 17.2 | 18.3 |
| Mexico | 8.8 | 8.4 |
| France | 8.6 | 8.9 |
| Canada | 6.9 | 7.1 |
| Italy | 6.3 | 6.8 |
| United Kingdom | 5.8 | 5.8 |
| Poland | 5.4 | 6.1 |
| Netherland | 5.3 | 6.2 |
Value USD Billion
China Rubber Export & Import Guide: Market Trends & Trade Opportunities
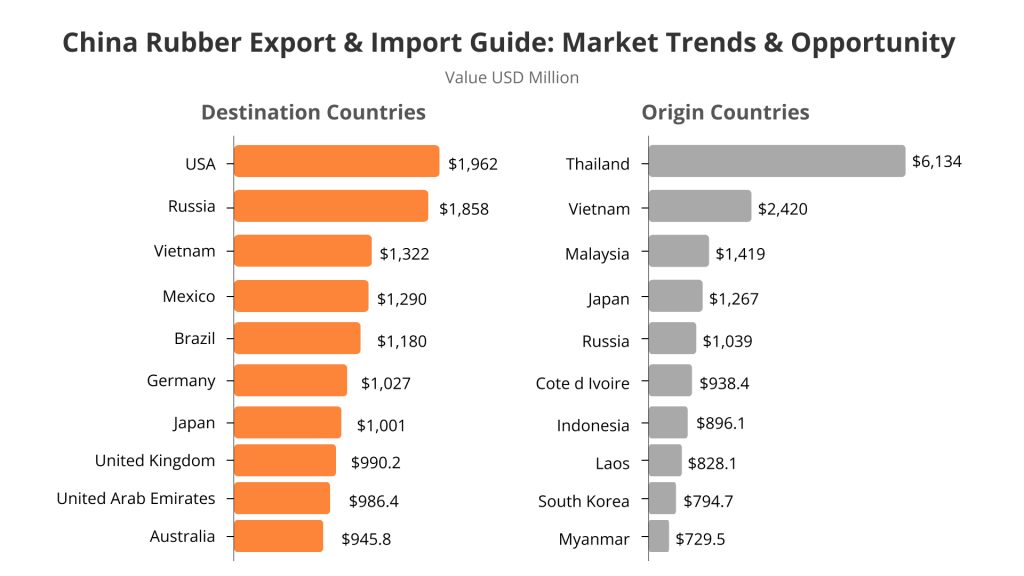
Globally, China occupies a strategic position in the rubber trade; it is simultaneously the world’s largest rubber exporter (primary synthetic rubber) and one of the world’s largest natural rubber importers. This dual role makes China the single most important price-setting country in the global rubber market.
Understanding China’s bilateral rubber trade flow is essential intelligence for any business in the rubber supply chain.
- China exports high-value synthetic rubber products (SBR, EPDM, NBR, speciality elastomers) to markets worldwide – manufactured from petrochemical inputs via its vast chemical industry. At the same time, China imports massive volumes of natural rubber from Southeast Asia and Africa to feed its world-leading tyre manufacturing sector.
- Thailand dominates as China’s top natural rubber source partner with $6,134M – more than all other suppliers combined. This reflects Thailand’s TSR20 grade, a premium quality preferred by Chinese tyre manufacturers.
- The United States ($1,962M) and Russia ($1,858M) are China’s top synthetic rubber buyers, though US-China trade tensions have periodically disrupted these flows.
- Vietnam’s $1,322M in Chinese rubber imports partly represents processing and re-export activity.
| Destination Country | Total Trade Value USD | Origin Country | Total Value USD Mn |
| USA | $1,962 | Thailand | $6,134 |
| Russia | $1,858 | Vietnam | $2,420 |
| Vietnam | $1,322 | Malaysia | $1,419 |
| mexico | $1,290 | Japan | $1,267 |
| brazil | $1,180 | Russia | $1,039 |
| germany | $1,027 | Cote d Ivoire | $938.4 |
| japan | $1,001 | Indonesia | $896.1 |
| united kingdom | $990.2 | Laos | $828.1 |
| united arab emirates | $986.4 | South Korea | $794.7 |
| australia | $945.8 | Myanmar | $729.5 |
Thailand Rubber Export & Import Guide: Market Trends & Trade Opportunities
Thailand is the undisputed world leader in natural rubber exports, accounting for approximately 33% or $5 billion of the world’s supply. Thailand’s natural rubber exports mainly deal in TSR20 (Technically Specified Rubber, Grade 20) and RSS3 (Ribbed Smoked Sheet, Grade 3). This is the benchmark product in the global natural rubber trade. The world-class rubber processing infrastructure and the Singapore Commodity Exchange (SICOM), where Thai rubber grades set a global price benchmark.
Thailand exported rubber worth $20.5 billion to 10 major destinations in 2025, with China alone absorbing $6,023 million. This concentration creates a significant dependency risk; any shift in Chinese buying behaviour or trade policy has an outsized impact on Thai export revenues and farmers’ income.
The USA is Thailand’s second largest buyer at $5,002, primarily for the tyre manufacturing (Goodgear, Cooper) and industrial rubber application.
Thailand’s rubber import side is relatively small ($2,504M total top 10).
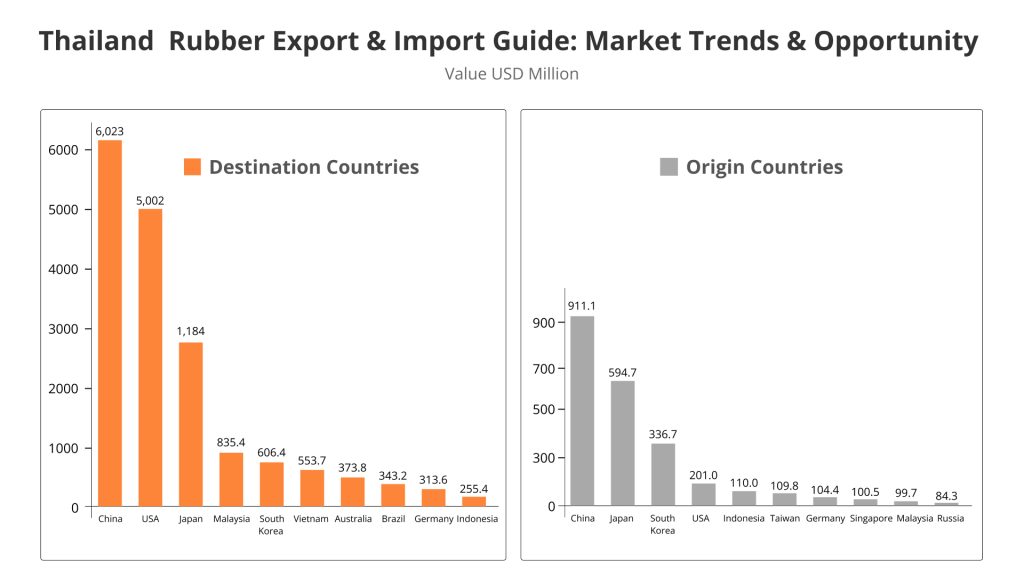
| Destination Countries | Value USD | Origin Country | Value USD Mn |
| China | 6,023 | China | 911.1 |
| USA | 5,002 | Japan | 594.7 |
| Japan | 1,184 | South Korea | 336.7 |
| Malaysia | 835.4 | USA | 201.0 |
| South Korea | 606.4 | Indonesia | 110.0 |
| Vietnam | 553.7 | Taiwan | 109.8 |
| Australia | 373.8 | Germany | 104.4 |
| Brazil | 343.2 | Singapore | 100.5 |
| Germany | 313.6 | Malaysia | 99.7 |
| Indonesia | 255.4 | Russia | 84.3 |
Germany Rubber Export & Import Guide: Market Trends & Trade Opportunities
Germany is the rubber trade hub of Europe – it is both the continent’s largest rubber exporter and one of its largest importers, reflecting its central role as a processor, manufacturer, and re-distributor of rubber products within the EU.
Germany’s rubber industry is anchored by world-class companies, including Continental AG ( tyres and automotive rubber), BASF (speciality rubber chemicals), Freudenberg (sealing technologies), and Henkel (rubber adhesives).
Intra-EU trade dominates Germany’s rubber exports—France, Poland, and Italy together receive nearly 40% of all German rubber exports.
These flows primarily represent finished and semi-finished rubber products (automotive parts, seals, profiles, hoses) rather than raw rubber.
Germany’s imports, by contrast, show a more global sourcing pattern, with China ($1,823M) as the single largest rubber import source, followed by Poland and the Czech Republic (EU supply chain partners).
Germany is also a gateway for rubber entering the EU from China ($1,823M), where Chinese synthetic rubber and rubber articles are partially re-processed and re-exported within Europe.
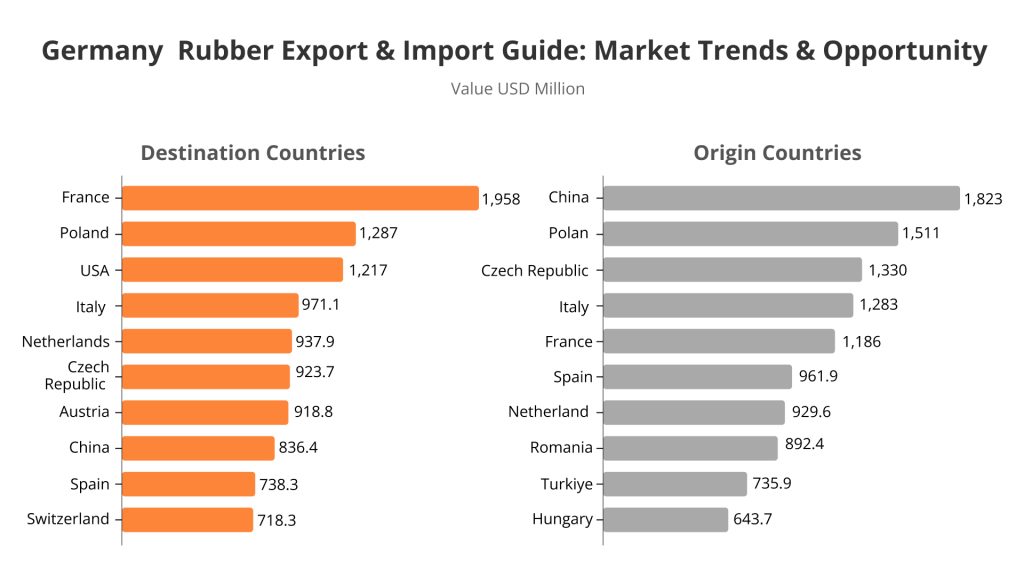
| Destination Country | Value USD | Origin Country | Value USD |
| France | 1,958 | China | 1,823 |
| Poland | 1,287 | Polan | 1,511 |
| USA | 1,217 | Czech Republic | 1,330 |
| Italy | 971.1 | Italy | 1,283 |
| Netherlands | 937.9 | France | 1,186 |
| Czech Republic | 923.7 | Spain | 961.9 |
| Austria | 918.8 | Netherland | 929.6 |
| China | 836.4 | Romania | 892.4 |
| Spain | 738.3 | Turkiye | 735.9 |
| Switzerland | 718.3 | Hungary | 643.7 |
How to Use Rubber Import Export Data for Business Advantage
For businesses operating in the rubber supply chain — from plantation operators and rubber traders to tyre manufacturers, industrial rubber products companies, and logistics providers – rubber trade data is a strategic intelligence asset, not just compliance documentation.
For Rubber Exporters & Suppliers
Rubber export data shows which countries import the most rubber by volume and value, identifies the suppliers holding market share in your target market, and reveals the unit prices accepted at customs.
If you are a Thai natural rubber exporter trying to expand into the indian market, HS 4001 import data for India reveals exactly which countries are your competitors, what volumes they are shipping, and at what implicit points.
For Rubber Importers & Manufacturers
Rubber import data helps you benchmark your sourcing costs – are you paying above or below what other manufacturers in your sector pay for the same rubber grade? It also helps you identify alternative supplier countries when your primary source faces supply disruption, or when you need to diversify your supply chain to meet EUDR or other compliance requirements.
For Rubber Traders & Brokers
Shipment-level rubber trade data – the granular records showing individual company names, vessel details, ports, and transaction values- is particularly valuable for traders. It reveals which companies are active buyers for a specific rubber grader in a specific market, enabling targeted outreach to qualified prospects. In markets like the US and several Latin American countries, this company-level data is publicly available through commercial trade intelligence platforms.
Key Rubber Trade Data Fields to Track
| Data Field | What It Tells You | Business Use Case |
| HS Code (4001 / 4002) | Natural vs synthetic; specific grade classification | Accurate product classification; tariff and duty calculation |
| Shipment Value (USD) | Total customs-declared value of the rubber shipment | Market sizing; unit price benchmarking |
| Quantity (MT/kg) | Physical volume of rubber shipped | Supply/demand tracking; capacity planning |
| Country of Origin | Where the rubber was produced | EUDR compliance; supply diversification decisions |
| Importer Name | Which company purchased the rubber | Lead generation; competitive intelligence for suppliers |
| Exporter Name | Which company sold and shipped the rubber | Supplier discovery; competitor sourcing analysis |
| Port of Loading / Discharge | Where rubber entered and left the shipping network | Logistics planning; supply chain route mapping |
| Unit Price (USD/MT) | Price per tonne accepted at customs | Procurement benchmarking; contract negotiation support |
Major Trends Reshaping Global Rubber Trade In 2026
Understanding the rubber market in 2026 means understanding the structural forces that will determine where rubber flows, at what price, and under what commodities for the next 3-5 years.
Trend 1 Electric Vehicle Changing Rubber Demand Fundamentals
‘As the modern world is adopting electric vehicles, the requirement for sidewalls and advanced tread compound is increasing natural rubber use per tyre by approximately 10-15% compared to ICE vehicle tyres.
Continental expanded the production capacity of its tyre plant in Ryong, while the global rubber market is expected to grow at a CAGR of approximately 5-6% through 2033.
Trend 2 EUDR – The Deforestation Regulation Reshaping Sourcing
The EU Deforestation Regulation (EUDR), which applies to large companies and small operators, requires importers to prove that their rubber supply chains are deforestation-free. This creates a two-tier rubber market, with EUDR-certified rubber commanding over non-certified supply. For European buyers, compliance is a legal requirement. Tradeability technology investments are surging.
Trend 3 Structural Supply Deficit – The Hidden Price Floor
Natural rubber has been in a supply deficit for multiple consecutive years. Ageing plantations (40%+ of trees over 30 years old), declining tapper workforce in Asia, and underinvestment following a decade of low prices have structurally constrained supply. No matter what happens to demand, this deficit creates a durable price floor.
Trend 4 Medical & Industrial Rubber Demand Surge
Medical-grade rubber demand grew rapidly % between 2021 and 2024, driven by post-pandemic glove manufacturing scale-up in Malaysia and Thailand. And growing demand for surgical equipment, catheters, and drug delivery systems.
Industrial rubber – gaskets, seals, hoses, vibration-dampening components – is growing at 7% + annually as construction and manufacturing expand globally. These sectors are diversifying rubber trade flow beyond the traditional tyre market, and are emerging as important demand growth pillars in the rubber import-export data.
Trend 5 Africa: the Next Rubber Production Powerhouse
The most underappreciated trend in the global rubber trade is Africa’s rapid emergence as a production force. Ivor Coast is already the world’s third-largest natural rubber exporter.
For rubber buyers in Europe, who must source from deforestation- free supply chains under EUDR, West African producers are building a structural advantage. Unlike fragmented smallholder networks in parts of Southeast Asia, African Large-Scale plantation operations can more strategically demonstrate deforestation-free sourcing, giving them preferential access to premium European buyers.
Conclusion
The global rubber market in 2026 is not just large – it is structurally stressed, geopolitically entangled, and on the cusp of a demand transformation. The data presented throughout this guide tells a clear, consistent story.
For business on every side of the rubber supply chain – exporters, importers, manufacturers, traders, and logistics providers – the most important strategic tool is real, current rubber trade data. Not forecar, not analyst report. Actual custom records showing who is buying from whom, at what price, and in what volumes – updated frequently.
Frequently Asked Questions
What is the HS code for rubber?
Rubber products are classified under HS chapter 40 – Rubber and Articles thereof. The two most critical codes are HS 4001 ( Natural rubber primary forms) and 4002 (synthetic rubber in primary forms). Countries add national digit extensions: 10-digit HTS in the US, 8-10 digit in the EU.
Which country exports the most rubber?
Thailand is the world’s largest natural rubber exporter, accounting for approximately 33% of global supply. Indonesia is the second largest rubber exporter, followed by the Ivory Coast and Vietnam. These countries together account for approximately half of the global natural rubber exports.
Which country imports the most rubber?
China is by far the world’s largest natural rubber exporter, driven by its position as the world’s largest tire manufacturer and automotive production base. China’s restocking cycles – when Chinese buyers step into the spot market- are one of the single largest drivers of short-term price movements globally. Other major importers include the United States, Germany, South Korea, and France.
What is EUDR, and how does it affect the rubber trade?
The EU Deforestation Regulation (EUDR) prohibits the import into the EU of commodities – including natural rubber – that are linked to deforestation. Large companies faced a December 2025 deadline; smaller enterprises had until June 2026. For the rubber trade, EUDR requires full supply chain traceability from the plantation to the EU import. This creates a two-tier market where EUDR-Certified rubber commands a 5-15% price premium. In West Africa and trade balance, Southeast Asian producers are the major beneficiaries of this structural market shift.
Reddy to access trade data?
Get shipment-level rubber import/export records — by HS codes 4001 & 4002,
country, company name, date, port of loading/discharge, and price.
Updated frequently • 190+ countries • Natural & Synthetic Rubber