
As the world is adopting fast-paced modern technology, copper is becoming more central to the circulatory system of the modern world economy. It flows through electric vehicles, semiconductors, manufacturing, renewable energy, and industrial machinery. Yet, in 2026, the majority of the procurement teams and supply chain executives are making billions of dollars ‘ worth of copper sourcing decisions with incomplete, outdated, or aggregated trade data.
The cost of that blindspot is affecting businesses, market expansion, missed potential suppliers, hidden counterparty risk, lost competitive advantage, and exposure to supply shocks in the world’s most complex commodity markets.
This comprehensive report changes all with shipment-level intelligence, historical trade data, and AI-powered insights that separate industry leaders from the rest
Why Copper Trade Intelligence Is Now a Boardroom Priority
For over a decade, the global copper trade was neither strategically critical nor more complex than it is today. With the rise in the energy transition, the demand for copper-intensive technologies and geopolitical tensions are reshaping traditional trade corridors.
As a result, procurement executives and supply chain leaders can no longer afford to rely on lagging market reports and supplier intelligence.
Notably, what sets today’s businesses apart from others is access to complete, regularly updated, and end-to-end supply chain analysis. This demonstrates not just what the copper market is doing, but which specific copper suppliers are shipping to which copper buyer, in what volumes, at what frequency, and through which trade routes. This is the new competitive advantage in the copper trade, and the companies that have built it are already pulling ahead.
According to copper trade data, the global market reached $265 billion in 2025, a 20.7% increase from $219.6 billion in 2021. This demand is fulfilled by electrification, EV manufacturing, and industrial expansion across Asia and North America. And, understanding this copper market at the shipment level is now a strategic imperative. Understand the copper market share.
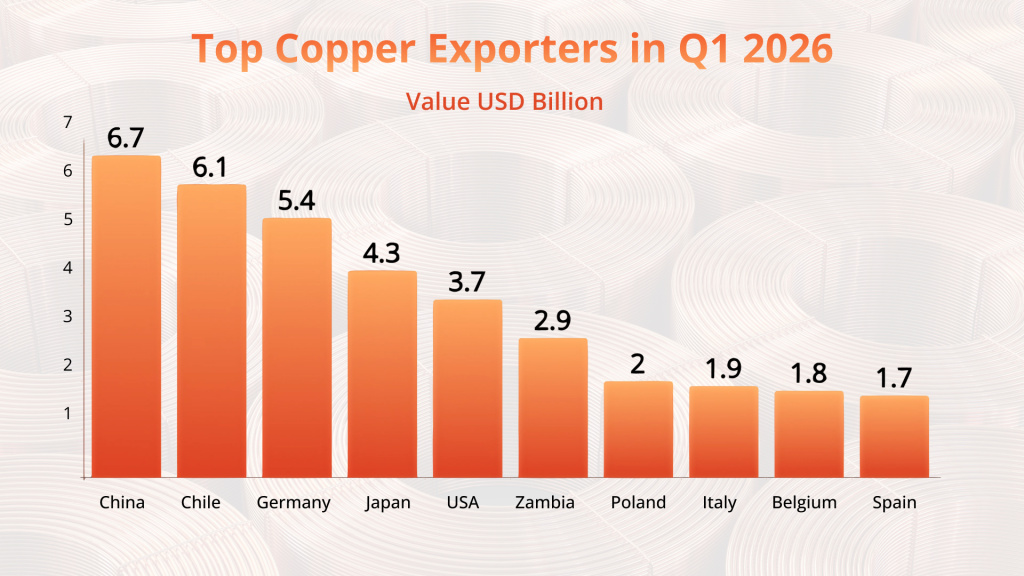
Top Copper Exporters In Q1 2026
In Q1 2026, copper import and export data highlight China’s emergence as the world’s leading exporter by value. Over the years, China achieved a significant structural shift from its historical position as a dominant net copper importer.
Chile ($6.1) and Germany ($5.4) follow closely, representing refined copper and semi-finished products exports driven by industrial value added.
| Top Copper Exporters | Value in USD Bn (Q1 2026) |
|---|---|
| China | 6.7 |
| Chile | 6.1 |
| Germany | 5.4 |
| Japan | 4.3 |
| USA | 3.7 |
| Zambia | 2.9 |
| Poland | 2.0 |
| Italy | 1.9 |
| Belgium | 1.8 |
| Spain | 1.7 |
Value USD Billion
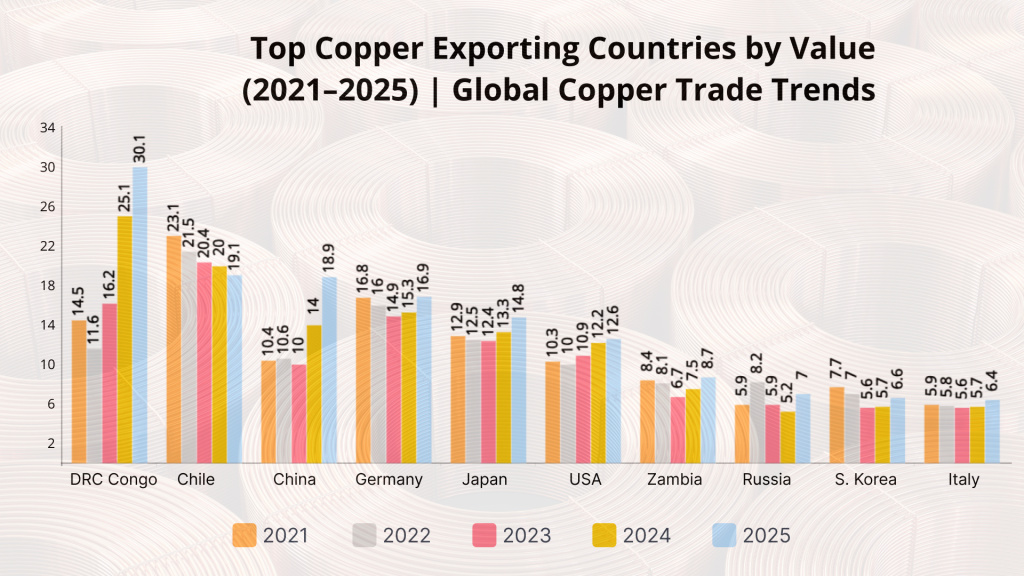
Historical Copper Export Trends 2021-2025: Five Years of Structural Shift
Global copper data over a five-year window demonstrates a comprehensive restructuring of copper export supply chains.
DRC Congo’s rise from $14.5B in 2021 to $30B in 2025 represents a massive 107% increase. This became the single most dramatic supply-side shift in the copper market this decade.
On the other hand, China simultaneously grew from $10.4B to $18.9B, rebalancing from pure net copper importer to copper exporter.
Chile, historically the world’s largest exporter, declined from $23.1 B to $19.1B over the same period. This contraction of 17.3% driven by ageing mine infrastructure and regulatory headwinds.
These structural shifts have profound implications for procurement strategy. Businesses that identified DRC Congo’s trajectory early. Using historical shipment data, businesses can establish supplier relationships and logistics corridors ahead of the broader market, gaining both pricing and supply security advantages that competitors could not easily replicate.
The DRC’s rise as the world’s fastest-growing copper export corridor has fundamentally changed supplier risk analysis. Procurement leaders who do not have shipment–level intelligence on DRC operators are underestimating both the opportunity and the counterparty risks embedded in their supply chain.
| Countries | 2021 | 2022 | 2023 | 2024 | 2025 |
|---|---|---|---|---|---|
| World | 219.6 | 209.7 | 206.5 | 231.6 | 265.0 |
| DRC Congo | 14.5 | 11.6 | 16.2 | 25.1 | 30.1 |
| Chile | 23.1 | 21.5 | 20.4 | 20.0 | 19.1 |
| China | 10.4 | 10.6 | 10.0 | 14.0 | 18.9 |
| Germany | 16.8 | 16.0 | 14.9 | 15.3 | 16.9 |
| Japan | 12.9 | 12.5 | 12.4 | 13.3 | 14.8 |
| USA | 10.3 | 10.0 | 10.9 | 12.2 | 12.6 |
| Zambia | 8.4 | 8.1 | 6.7 | 7.5 | 8.7 |
| Russia | 5.9 | 8.2 | 5.9 | 5.2 | 7.0 |
| S. Korea | 7.7 | 7.0 | 5.6 | 5.7 | 6.6 |
| Italy | 5.9 | 5.8 | 5.6 | 5.7 | 6.4 |
Value USD Billion
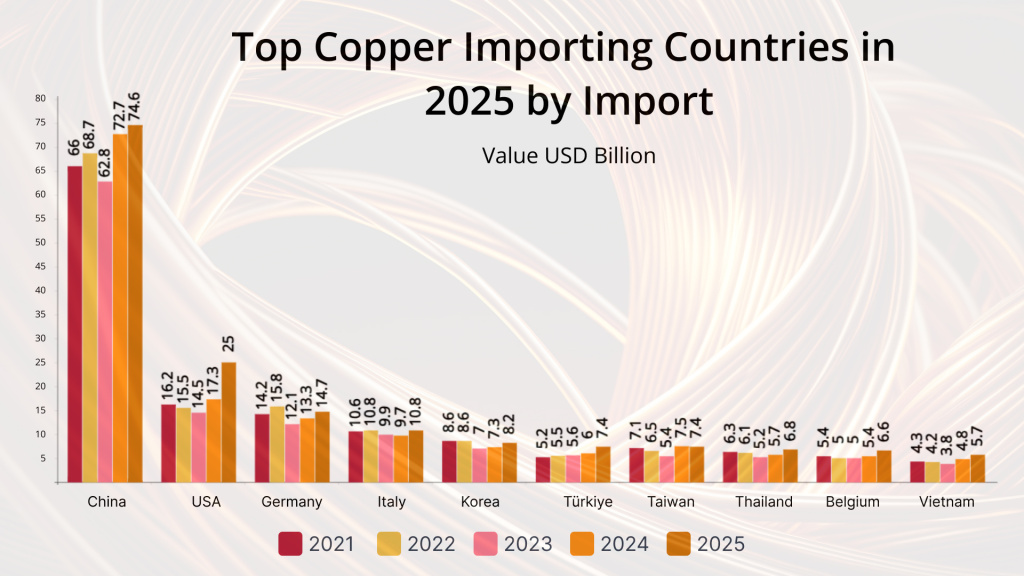
Global Copper Import Intelligence: Who is Buying from Whom?
Understanding the copper import market is strategically more important than the copper export picture. Here’s a breakdown of the top copper-importing countries —
- China dominates the copper import market with $74.6 billion in 2025. This becomes equivalent to approximately 27.5% of total world imports.
- Notably, the real picture for market expansion strategies lies in the 2nd spot; the USA copper import surged from $14.5B in 2023 to $25.0 B in 2025, a 72.4% increase. This massive increase in import volume was driven by domestic manufacturing reshoring and EV infrastructure investment.
- Remarkably, emerging markets are accelerating fastest; Turkey grew copper imports by 42.3% from 2021 to 2025. Whereas Vietnam’s copper import value increased by 32.6%.
- These rapidly growing markets highlight priority targets for exporters seeking to diversify beyond the China trade lane, and the companies already shipping into these markets are identifiable today through historical shipment data.
| Copper Exports | 2021 | 2022 | 2023 | 2024 | 2025 |
|---|---|---|---|---|---|
| World | 229.4 | 232.9 | 215.4 | 244.0 | 271.1 |
| China | 66.0 | 68.7 | 62.8 | 72.7 | 74.6 |
| USA | 16.2 | 15.5 | 14.5 | 17.3 | 25.0 |
| Germany | 14.2 | 15.8 | 12.1 | 13.3 | 14.7 |
| Italy | 10.6 | 10.8 | 9.9 | 9.7 | 10.8 |
| Korea | 8.6 | 8.6 | 7.0 | 7.3 | 8.2 |
| Türkiye | 5.2 | 5.5 | 5.6 | 6.0 | 7.4 |
| Taiwan | 7.1 | 6.5 | 5.4 | 7.5 | 7.4 |
| Thailand | 6.3 | 6.1 | 5.2 | 5.7 | 6.8 |
| Belgium | 5.4 | 5.0 | 5.0 | 5.4 | 6.6 |
| Vietnam | 4.3 | 4.2 | 3.8 | 4.8 | 5.7 |
Value USD Billion
How AI-Powered Copper Supply Chain Intelligence Helps Businesses
Traditional trade intelligence was usually based on trade statistics that were aggregated, anonymized, and always several months behind the real ones. But with the emergence of AI, the copper supply chain has fundamentally changed the way trade happens. By ingesting and structuring millions of individual bill-of-lading records, customs declarations, and port manifest data, we (Export Genius) convert raw shipment records into procurement intelligence that is actionable with regularly updated trade insights.
Here is the list of top functions –
- Supplier Discovery: Discover and identify all potential copper exporters in DRC, Chile, or Zambia with verified shipment histories to your target import markets.
- Competitor Benchmarking: Analyze the list of competitors and understand which suppliers they use and at what shipment frequencies before your next sourcing cycle begins.
- Risk Analysis: Screen all copper entities globally and identify potential associated risk factors against the global watchlist.
- Market Expansion: Identify potential emerging market opportunities such as Vietnam, Turkey, and the specific importers growing fastest in those corridors, using comprehensive copper import data.
- Procurement Intelligence: Validate supplier claims against actual shipment records to strengthen due diligence and leverage in negotiations for long-term supply agreements.
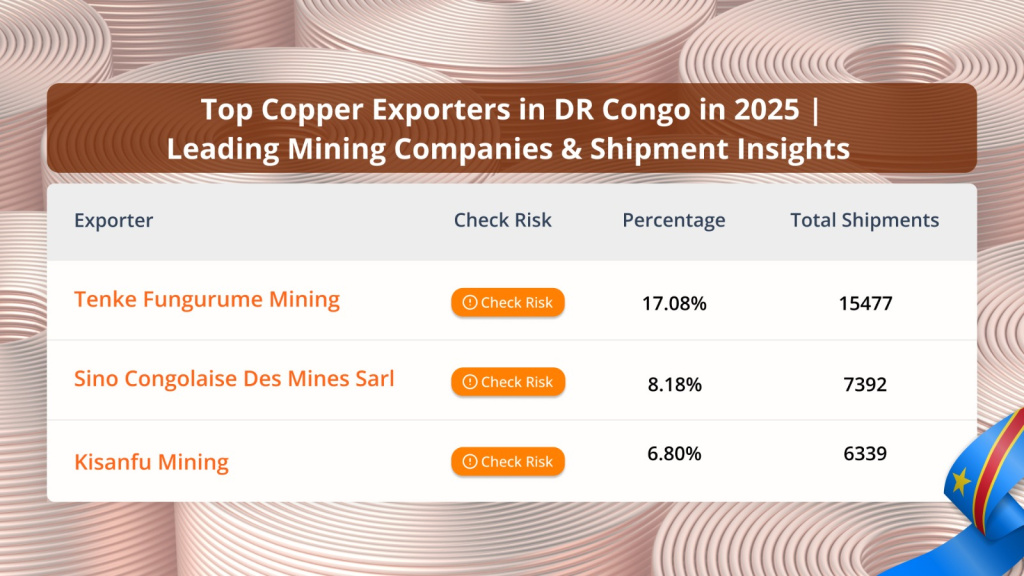
DRC Congo Trade Intelligence: The World’s Fastest-growing Copper Export Corridor
According to Global Copper trade data, DRC Congo now controls around 11% of the global copper export market, up from 6.6% in 2021. Despite this, the DRC Congo remains one of the most opaque sourcing environments in the world, with limited public visibility into which mining operators are shipping, at what volumes, and with what risk profile.
Our platform brings company-level shipment data from DRC, enabling procurement teams to conduct supplier discovery, risk check individual exporters, and benchmark competitors’ supply chain patterns causing verified shipment records. For instance –
Tenke Fungurume Mining is one of the largest copper exporters and accounts for around 17% of copper export, while other Sino Congolaise Des Mines Sarl, and Kisanfu Mining accounts 8.18% and 6.8% repespectily in 2025.
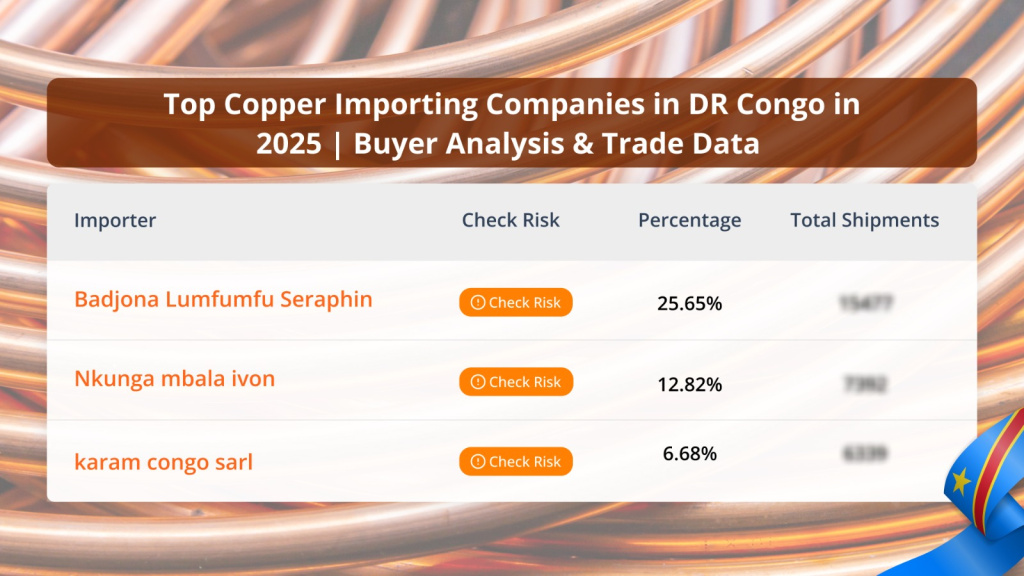
On the copper import side, Badjona Lumfumfu Seraphin accounts for around 25.65% of copper importers, while Nkunga mbala ivon and karam congo sarl accounts 12.8% and 6.68% respectively, in 2025.
Nowadays, the global supply chain requires more than visibility. Screening supplier network against risk lists, export controls, and compliance records helps businesses uncover vulnerabilities, reduce exposure, and build resilience in trade ecosystems.
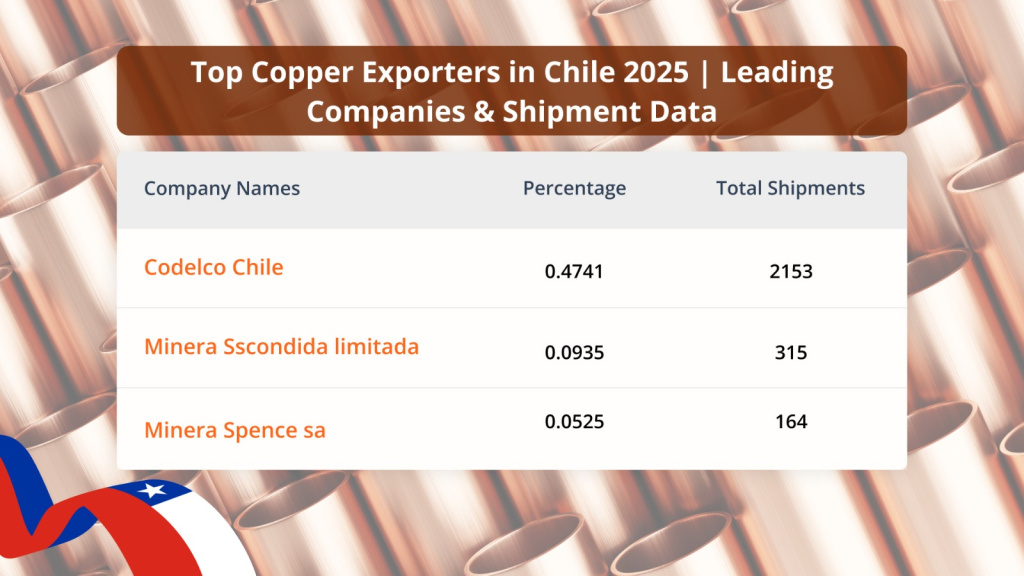
Chile Copper Intelligence
Chile remains a structural cornerstone of global copper supply despite its declining aggregate market share, with world-class operations from state-owned and private mining majors. For instance –
Codelco Chile is one of the largest government entities and an undisputed copper exporter in Chile, and accounts 47.4% in 2025 with a total of 2153 shipments.
Minera Sscondida limitada and Minera Spence sa are among the top copper exporting companies with 9.35% and 5.25% respectively, in 2025.
For buyers diversifying away from DRC supply concentration, Chile represents a mature, lower-risk alternative with an established logistic corridor to Europe and Asia.
Codelco’s dominance in Chilean copper shipments nearly halves the country’s export volume by count – mean any disruption in their operation triggers immediate global supply chain consequences. platforms that give buyers a clear picture of actual shipment frequencies, not lagged aggregate data, are essential risk management infrastructure for any copper-intensive industry.
Copper Competitive Intelligence –
Across the world, all the major procurement organizations in the copper-intensive industries, such as battery manufacturers, EV OEMs, electrical grid developers, and industrial conglomerates, have systematically adopted trade intelligence into their sourcing framework. The operational advantages are measurable and compounding across multiple dimensions. For instance –
Supplier Diversification Using Shipment Records –
A European EV battery manufacturer used copper historical shipment data to identify that 68% of their copper supply was routed through a single DRC operator. By cross-referencing trade analytics to identify alternative Zambian and Chilean operators already shipping to European ports, they reduced single-supplier concentration risk from 68% to 31% withing two sourcing cycles, without disrupting production continuity.
Competitor Analysis Using Import Export Data
A US-based copper wire manufacturer identified through import-export data that three of their direct competitors had begun sourcing from an emerging Zambian operator 18 months before that operator appeared in any public market report. Early engagement with that supplier, enabled by supply chain intelligence, secured preferred pricing and supply priority that competitors could not subsequently match.
Supply Chain Risk Analysis: Building a Copper Sourcing Risk Framework
Analysis of the global copper trade data demonstrates a structured, evidence-based approach to supply chain risk analysis. Rather than relying on qualitative company risk, procurement teams can build a risk framework anchored in actual shipment behaviour, volume trends, shipment frequency, counterparty diversification, and route exposure. Here are the top dimensions of a data-driven copper supply chain risk framework are —-
Concentration Risk – The proportion of the supplier base accounted for by the top 3 operators in any country. Chile’s top 3 operators account for 62% of shipments, DRC’s top 3 for approximately 32% high concentration in either market creates systematic vulnerability.
Corridor Volatility – Historical shipment variance by trade lane, DRC-to-China lanes show significantly higher volume variance than Chile-to-Germany lanes, reflecting both logistics infrastructure maturity and geopolitical exposure.
Logistic Intelligence – Port congestion patterns, transit time variance, and freight cost trends across key copper trade lanes, enabling procurement teams to build buffer inventory strategies based on corridor-specific lead time risk.
FAQ’s
Who is the largest copper exporter in the world in 2026?
In Q1 2026, China is the largest copper exporter with $6.7 billion in exported value, followed by Chile at $6.1 billion and Germany at $5.4 billion. In terms of raw copper ore and concentrate, DRC congo has become the fastest-growing exporter, with $30.1 billion in exports in 2025.
Which country imports the most copper in the world?
China is by far the largest copper importer globally, with $74.6 billion in copper imports in 2025, demonstrate 27.5% of total global copper imports. The USA is the second largest at $25.0 billion in 2025, a figure that grew 54.3% from 2021 to 2025.
What is historical shipment data, and how is it used in copper procurement?
Historical shipment data refers to actual records of individual commercial shipments derived from bill of lading customs declarations, and port of loading and unloading. In copper procurement, this data is used for supplier discovery, competitor benchmarking, supply chain analysis, risk check, and identifying fastest-growing import markets.
Which emerging markets are growing fastest as copper importers?
According to copper trade data, from 2021 to 2025, the fastest growing copper markets are the USA (54.3%, Turkey (42.3%), Vietnam (32.6%), and Belgium (22.2%). These markets represent priority targets for copper exporters pursuing market expansion strategies.
Who are the biggest copper mining companies exporting from Chile in 2025?
According to Chile copper data, Codelco Chile is the dominant exporter with a 47.41% share of Chilean copper shipments (2,153 total shipments), Minera Escondida Limitada accounts for 9.35%, and Minera Spence SA for 5.25%.
How do I use copper import-export data for competitor analysis in copper supply chains?
Copper import-export data enables competitor analysis by revealing which suppliers your competitors are sourcing from, at what shipment frequency, and in what volumes. By cross-referencing competitor entities against the trade dataset, procurement teams can identify their rivals’ supplier relationships and benchmark their own supplier diversification against industry peers.
How fast is DRC Congo growing as a copper exporter?
DRC Congo’s copper export value grew from $14.5B in 2021 to $30.1 B in 2025, a 107% increase in four years, making it the fastest growing copper export corridor in the world.
Conclusion –
As per copper trade data, the global copper market in 2026 is defined by accelerating demand, shifting supply geographies, and growing counterparty complexity. With DRC Congo emerging as the world’s fastest-growing copper export corridor, China simultaneously acting as the world’s largest exporter and importer, and markets like the USA and Vietnam growing import demand at rates exceeding 50% over four years.
In this competitive world, the companies gaining a competitive advantage are not those with the largest procurement budgets. They are the ones converting historical copper shipment data and AI-powered analytics into sourcing decisions, risk frameworks, and market expansion strategies that competitors cannot replicate from the public.
This has now become a core requirement for any business with meaningful copper supply chain exposure, and the platform to access it are available today.