


China’s trade has increased significantly over the past years, especially after the pandemic-ridden time in 2020. Amidst the different dynamics of the global economy and multilateral trade, various factors have contributed to a high rise in China’s trade values.
The global trade activities rebounded in 2021, followed by the increased production of electronics, automobiles, and more products, inflated rates of consumer products, shortage of commodities, and the Russian invasion of Ukraine, China’s values have only increased throughout. Have a look at how much Chinese imports and exports have grown so far.
China’s Historical Imports-Exports
China’s imports have diminished in the years after 2018 which amounted to $2.13 trillion. In 2019, the imports amounted to $2.06 trillion, followed by $2.05 in 2020. However, in 2021, the total value of imports rose to $2.6 trillion and, in 2022, the total value of imports stood at $2.7 trillion.
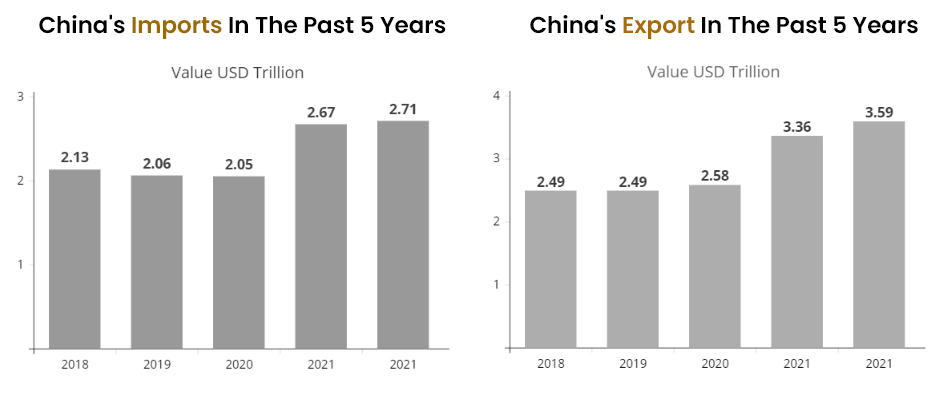
China’s exports have not been much impacted by any factor except for the year 2020 due to the pandemic. In 2018, the total value of imports amounted to $2.4 trillion, followed by $2.4 trillion in 2019, $2.5 trillion in 2020, $3.3 trillion in 2021, and finally in 2022, the import value was $3.5 trillion.
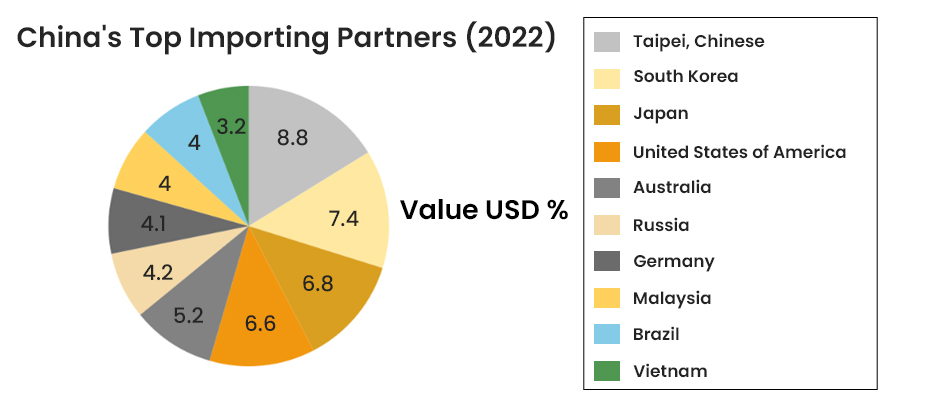
China’s Top Trading Partners
According to China’s trade data, the top trading partners of China have been featured in the datasets shown below. These partner countries of China have contributed to the overall growth of the Asian country and are still adding to the value of Chinese imports and exports.
China’s import data 2022 reveals that the top 10 importing partners of China are—Taipei, Chinese (8.8%), followed by South Korea (7.4%), Japan (6.8%), the USA (6.6%), Australia (5.2%), Russia (4.2%), Germany (4.1%), Malaysia (4%), Brazil (4%), and Vietnam (3.2%).
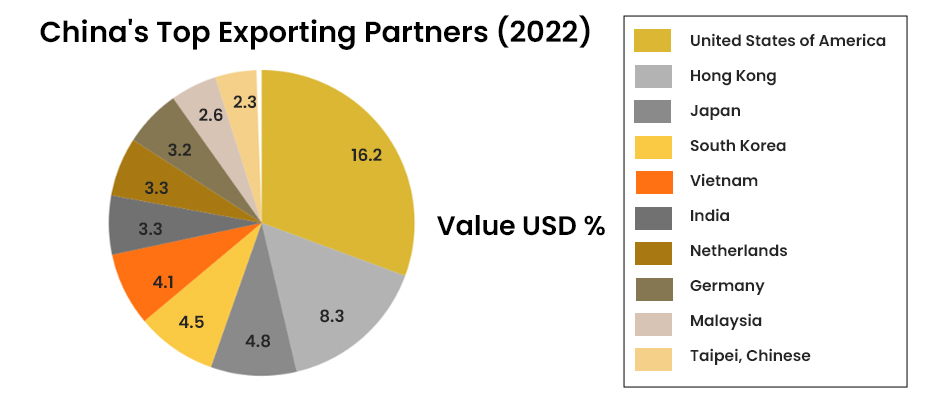
China’s export data 2022 reveals that the top 10 exporting partners of China are—the USA (16.2%), Hong Kong (8.3%), Japan (4.8%), South Korea (4.5%), Vietnam (4.1%), India (3.3%), the Netherlands (3.3%), Germany (3.2%), Malaysia (2.6%), and Taipei, Chinese (2.3%).
Trade Balance Comparison
The shown China import-export data features the total value of imports and exports, along with the trade balance, providing information necessary to evaluate the growth of the trade surplus in the year 2022 compared to the year 2021.
China’s total imports and exports in 2021 amounted to values of $2.6 trillion and $3.3 trillion, respectively. The resulting trade surplus from the exceeding value of the export in comparison to the imports amounted to $686.13 billion.
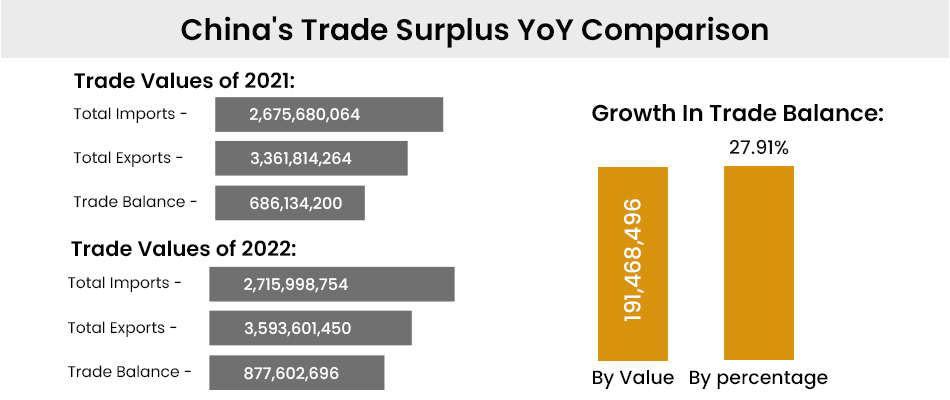
China’s total imports and exports in 2022 amounted to values of $2.7 trillion and $3.5 trillion, respectively. The resulting trade balance after comparing the total value of imports and exports in 2022, the trade surplus amounted to $877.60 billion.
After examining the shown China trade data 2022, the evaluation of the values reveals that the difference between the total value of trade surplus and balance of 2021 with the values of 2022 registered an increase of $191.46 billion and 27.91% by percentage.