


The United States of America, the world’s largest gas producer and exporter, is working on a new gas pipeline on Mexico’s coast to bypass the drought-chocked Panama Canal and establish a direct trade route to Asia. This route potentially cuts travel times and costs significantly.
Once the development of the proposed project is completed, it will transform Mexico’s gas terminal into an export facility for American-produced gas, marking a major trade shift internationally in the gas trade dynamics.
Why is the USA Eyeing Asia for Its Gas Market?
Asia is the fastest-emerging market in the world, contributing approximately 17% of global trade. Like advanced economies, Asia has started the process of shifting industries based on fossil fuels to sustainable sources like natural gas and other renewable sources of energy. This has accelerated Asia’s demand for natural gas, which is primarily coming from countries like China and India and the fastest-growing economies from Southeast Asian countries.
Let’s understand how this exponentially growing demand for natural gas in Asia prepares the market for untapped market opportunities for the USA’s gas exporters.
USA’s export of Natural gas to Asia over the years increased from USD 15177 million in 2019 to USD 39479 million in 2022, this drastic change is the result of softening the policies and licencing requirements for exporting and extracting natural gas in the USA, and other factors. On the other hand, the imports from Asia also increased from 2019 to 2023, except for the marginal downfall in the year 2021.
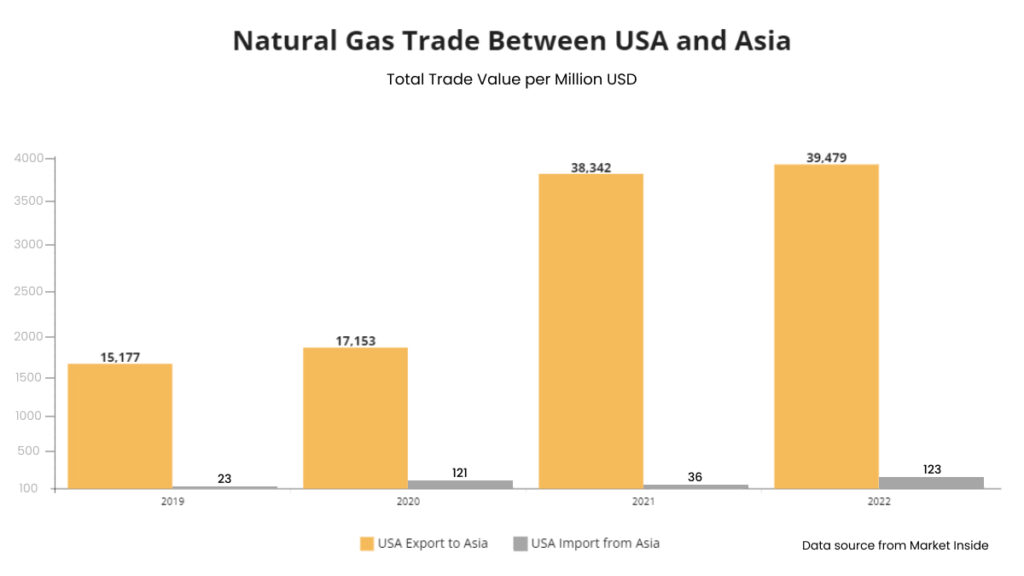
| Year | USA Export to Asia | USA Import from Asia |
| 2019 | 15177 | 23 |
| 2020 | 17153 | 121 |
| 2021 | 38342 | 36 |
| 2022 | 39479 | 123 |
Not only the USA but the whole world is targeting the unexplored market for natural gas in Asia. With more than USD 324 billion in imports in 2022 which increased from USD 163 in 2019, and concreting the base for the future markets. However, the export of the same commodity witnessed an upward trend except for a marginal downfall in the year 2020. This fluctuation may be attributed to several factors such as changing geopolitical scenarios, conflicts between nations and other issues.

| Year | Asia Import from the World | Asia Export to the World |
| 2019 | 163 | 91 |
| 2020 | 134 | 87 |
| 2021 | 209 | 134 |
| 2022 | 324 | 193 |
Trade of Natural Gas Between USA and Mexico
The following mention table presents data on the export-import of natural gas between the USA and Mexico for the last five years. There is a remarkable fluctuation in exports over the years. In 2019, the export of natural gas to Mexico was USD 6168 billion and witnessed a downward trend in the years 2020 and 2023 (Till Nov), this decrease in the trend can be attributed to numerous geopolitical issues. On the other hand, the highest import to the USA from Mexico was in the year 2019 and surprisingly decreased to USD 5 million till Nov 2023.
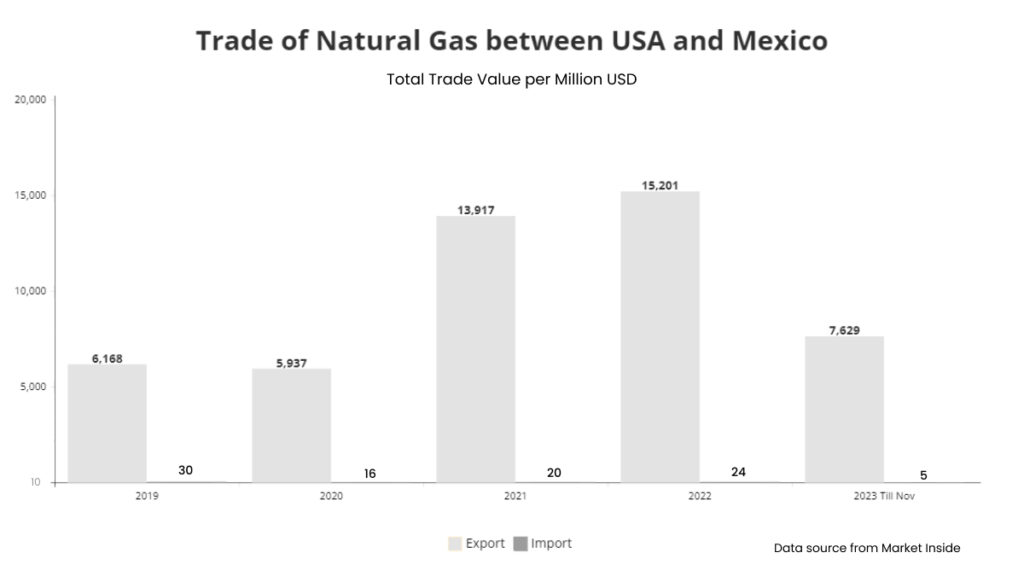
| Year | Export | Import |
| 2019 | 6168 | 30 |
| 2020 | 5937 | 16 |
| 2021 | 13917 | 20 |
| 2022 | 15201 | 24 |
| 2023 Till Nov | 7629 | 5 |
The total trade value of exports and imports of natural gas by the USA to the world increased over the last five years, the highest ever growth in exports was registered in the year 2022 with more than USD 96272 billion, and for the imports was with USD 24123 billion. The growth potential of export for natural gas increased by threefold from 2019 to 2022. The year 2023, slowed down the growth, and this slowdown may attribute to many factors, for instance, the Israel-Hamasa conflict, the Russia-Ukraine conflict and others.
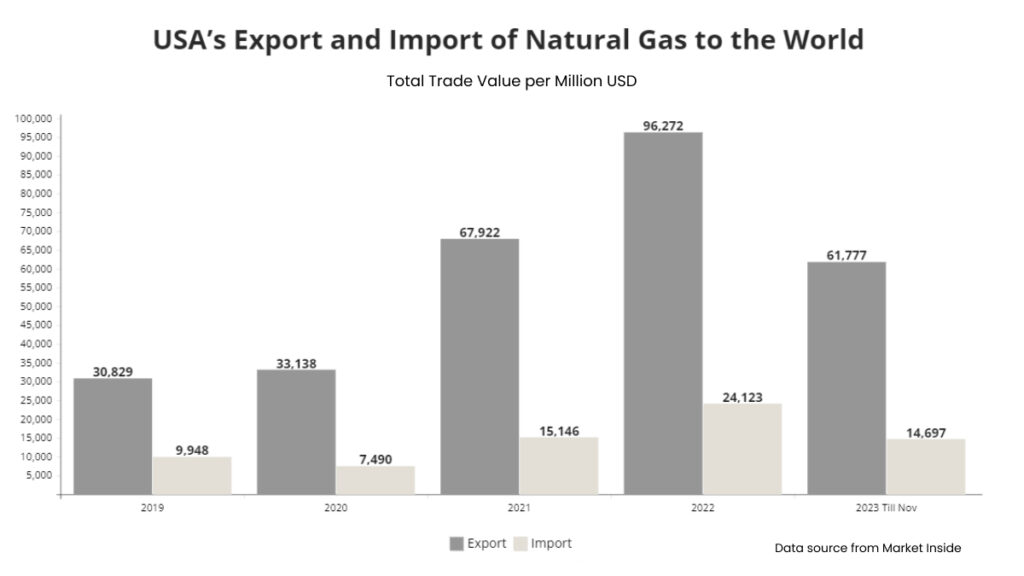
| Year | Export | Import |
| 2019 | 30829 | 9948 |
| 2020 | 33138 | 7490 |
| 2021 | 67922 | 15146 |
| 2022 | 96272 | 24123 |
| 2023 Till Nov | 61777 | 14697 |
Key Challenges May Arise for USA’s Gas Export
- Potential leaks in the pipe may pollute the ocean as well as the marine environment
- Rapidly changing geopolitical scenario.
- Competition from Russia and other major exporter of the natural gas.
- Risk associated with Environment.
Opportunity for Natural Gas around the World
- The market is continuously growing from $1,029.88 billion in 2023 to $1,127.09 billion in 2024 with a 9.4% annual growth rate.
- By 2028, the market value for natural gas will be more than $1518 billion globally.
- Market is shifting from a fossil-based industry to a natural gas-based industry.
It becomes important for both businesses and the government to work on a constructive plan and policies to bring a business-friendly environment for fostering the growth and effectively utilizing the potential.