


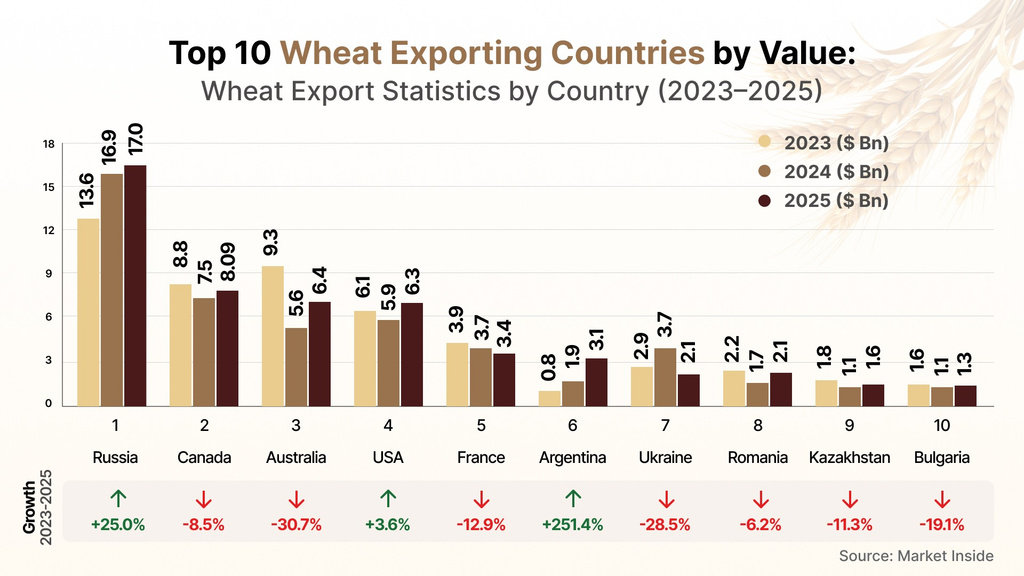
Russia is the largest wheat exporter, with about $17.0 billion in wheat exports in 2025, more than double Canada’s wheat exports ($8.09 billion). Australia, the USA, France and Argentina follow. Global wheat export value fell about 21% between 2023 and 2025, to $48.9 billion.
Key Highlights
- Russia leads wheat exports by value and grew 25% from 2023 to 2025.
- Argentina had the fastest-growing wheat exports in the table, from $0.8B to $3.1B.
- Australia’s wheat exports fell 30.7,% and Ukraine’s fell 28.5%.
- USDA projects 2026/27 world wheat trade at 211.77 million tonnes, down from 227.64 million in 2025/26.
- Canada wheat exports are forecast at 28.5 million tonnes in 2026-27, down 1.2 million tonnes.
Introduction
Wheat is one of the most important traded commodities in the world; it feeds billions and supports industries from food processing to animal feed. However, global wheat exports are highly concentrated, with Russia leading the market by value, followed by Canada and other major wheat exporters in Europe and the Southern Hemisphere.
This concentration indicates vulnerability of the wheat market and its supply chain. Any bad weather, a poor harvest, or a shipping problem in any top wheat-exporting country can affect prices and supply worldwide. This article covers the top 10 wheat exporters, trade values, wheat HS Codes, market trends, and global outlook.
Who Is the Largest Wheat Exporter?
The largest wheat exporter by value is Russia, at $17.0 billion in 2025. Canada ranks second at $8.09 billion, followed by Australia ($6.4B), the USA ($6.3B), and France ($3.4B).
Russia’s wheat export market is structural and strategic. It has large, climate-friendly harvests, a strategically located black sea port, and competitive prices. The table below ranks the top ten wheat exporters and shows why the “largest wheat exporter” question has a crystal-clear answer: Russia is far ahead and a dominant player in the wheat market.
Top 10 – Wheat Exporters: Statistics by Country
The table below highlights the top 10 wheat exporters from 2023-2025 and the wheat growth over that period. Further, this indicates who gains and loses market share as prices and volumes shift.
| Rank | Top Wheat Exporter | 2023 ($B) | 2024 ($B) | 2025 ($B) | Growth 2023–2025 |
|---|---|---|---|---|---|
| — | World | 61.8 | 53.7 | 48.9 | -20.8% |
| 1 | Russia | 13.6 | 16.9 | 17.0 | +25.0% |
| 2 | Canada | 8.8 | 7.5 | 8.09 | -8.5% |
| 3 | Australia | 9.3 | 5.6 | 6.4 | -30.7% |
| 4 | USA | 6.1 | 5.9 | 6.3 | +3.6% |
| 5 | France | 3.9 | 3.7 | 3.4 | -12.9% |
| 6 | Argentina | 0.8 | 1.9 | 3.1 | +251.4% |
| 7 | Ukraine | 2.9 | 3.7 | 2.1 | -28.5% |
| 8 | Romania | 2.2 | 1.7 | 2.1 | -6.2% |
| 9 | Kazakhstan | 1.8 | 1.1 | 1.6 | -11.3% |
| 10 | Bulgaria | 1.6 | 1.1 | 1.3 | -19.1% |
- Wheat Export Growth: Russia (+25%) and Argentina (+251 %) recorded the strongest growth among the top wheat exporters, highlighting shifts in global wheat supply, export competitiveness, and opportunities across international wheat markets.
- Decline in Wheat Export Market: According to wheat export data, global wheat export value fell sharply by 21%, while Australia and Ukraine lost around 30% of their wheat export markets.
- Wheat export Opportunities: Argentina is the only country among the top 10 wheat exporters that grew sharply by 251.4%. This drastic growth shows that competitive prices, stronger supply, and an expanding export market can reshape global wheat trade.
- Wheat Market Risk Exposure: Over the years, global wheat export values have declined by approximately 20%, and this drastic decline can pressure wheat exporters’ margins, affecting wheat prices, shipment volumes, destination markets, and buyers’ demand.
- Global wheat export market trend: According to wheat export data, internationally, wheat exporters are competing for market share as trade values shift across Russia, Canada, Australia, the USA, and other major suppliers.
Russia’s rise to $17B reshapes the wheat export landscape, while Argentina’s rapid growth signals how quickly emerging wheat exporters can challenge established global suppliers.
Top Wheat Producing Countries vs. Exporters
It’s interesting to note that the top wheat-producing countries are not always the top exporters. China and other asian countries are among the largest producers, but they consume most of their crop domestically. Exporters such as Russia, Canada, Australia, and France produce more than they need and sell the surplus.
The overall wheat exports across the world highlight how much wheat exists and how it reaches the world market.
Canada Wheat Exports and Canadian Wheat Export Data
According to the wheat export data, Canada is the world’s second-largest wheat exporter by value, at $8.09 billion in 2025. Further, Canadian wheat export data shows a sharp decline of 8.5% from 2023, but Canada’s wheat exporters have maintained their rank against a falling world market.
Canadian wheat exports are forecast to fall in the coming season. Agriculture and Agri-Food Canada (AAFC) forecasts total wheat exports at 28.5 million tonnes in 2026-27, down 1.2 million tonnes on the year. USDA’s Ottawa attaché expects total wheat production of 34.6 million tonnes, 13% lower than the previous year, because of less area planted and a return to lower average yields. The same report notes that excellent growing conditions could push yield above recent averages.
This wheat supply outlook also matters for Canada’s position in the durum wheat export market.
Durum Wheat Export Market
Globally, the durum wheat export market is a smaller but consistent and valuable segment, and Canada is one of its major suppliers. Durum is the wheat used for pasta and semolina, and it trades separately from bread wheat.
AAFC’s September estimate puts Canadian durum carryout stocks at 1.5 million tonnes in 2026-2027, up from 1.102 million tonnes in 2025-26. Largest stocks generally add supply to the durum wheat export market and can weigh on prices.
Beyond durum wheat export value, wheat trade data also reveals who is moving the largest quantities.
Wheat Trade Data: Quantity Leaders in 2026
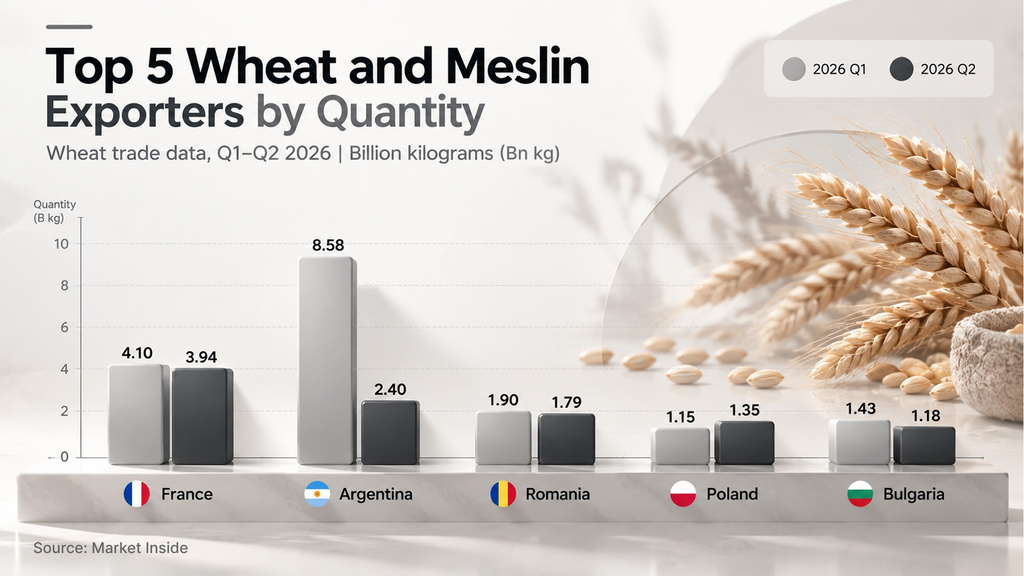
Wheat export value and volume can tell different stories. This table shows 2026 quarterly quantities for wheat and mesline (a wheat-rye-millet). It shows who is physically shipping the most grain right now.
| Rank | Top Wheat Exporters | 2026 Q1 (Bn kg) | 2026 Q2 (Bn kg) |
|---|---|---|---|
| 1 | France | 4.10 | 3.94 |
| 2 | Argentina | 8.58 | 2.40 |
| 3 | Romania | 1.90 | 1.79 |
| 4 | Poland | 1.15 | 1.35 |
| 5 | Bulgaria | 1.43 | 1.18 |
- Growth: Among the top wheat exporters by quantity, Poland was the only major exporter to increase wheat and meslin export quantity, rising from 1.15 billion kg in Q1 to 1.35 billion kg in Q2 2026.
- According to wheat export data, Argentina recorded the sharpest fall in wheat export quantity, dropping from 8,5 billion kg in Q1 to 2.40 billion kg in Q2 2026. This is consistent with a harvest-driven export peak early in the year.
- Argentina’s Q1 shipment reached 8.58 billion kg, making it the largest quarterly wheat and meslin exporter by quantity among the top wheat suppliers.
- Wheat export data highlights that France, Romania, Poland, and Bulgaria recorded consistent wheat export quantities and are established European wheat suppliers across the global wheat trade.
Quarterly wheat trade data reveals sharp seasonal shifts in export quantities, showing why shipment volumes can provide insights that annual wheat export values may hide.
Now, let’s understand how wheat exports are classified in trade data, and which HS Codes you need to track.
Wheat Export HS Code List
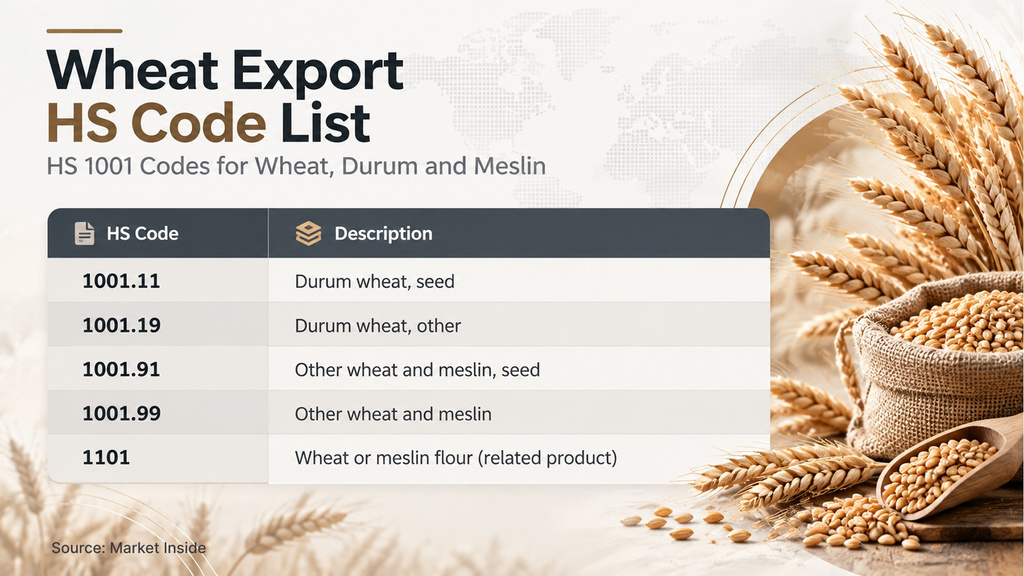
Wheat exports are classified under HS heading 1001 (“wheat and meslin”). Customs agencies and trade databases use these codes to record wheat export statistics by country.
| HS code | Description |
|---|---|
| 1001.11 | Durum wheat, seed |
| 1001.19 | Durum wheat, other |
| 1001.91 | Other wheat and meslin, seed |
| 1001.99 | Other wheat and meslin |
| 1101 | Wheat or meslin flour (related product) |
National tariff schedules add extra digits, so confirm the full code with your customs authority.
Now that we have identified the major wheat exporters and HS codes, let’s understand what’s happening in the global wheat market right now.
Current News and Market Situation
Global wheat trade is tightening in 2026/27. USDA’s September WASDE puts 2026/27 world wheat production at 822.43 million tonnes, trade at 211.77 million, and ending stocks at 276.29 million, compared with 843.99, 227.64, and 280.60 million for 2025/26.
To understand the tightening global wheat trade, let’s first look at the Black Sea region, one of the key supply hubs.
- Black Sea: USDA’s chief economist said expected export totals are the lowest in about five years, driven mainly by the Black Sea region. SovEcon cut its Russian 2026/27 wheat export forecast by 1.9 million tonnes to 44.6 million tonnes, citing continued Sea of Azov shipping restrictions. IKAR trimmed its Russian export potential to 44.5 million tonnes, largely because of smaller sown area.
But the supply picture is not limited to the Black Sea—let’s see how conditions in the United States are affecting wheat prices.
- United States: The drought in the hard red winter wheat belt is keeping domestic prices elevated, and USDA’s September season-average price is $6.40 a bushel, up $1.34 from the previous year.
Meanwhile, Australia is moving in a different direction, so let’s look at what its latest production outlook means for global wheat supply.
- Australia: ABARES raised its 2026/27 production forecast by 12% to 29.9 million tonnes, though output remains 17% below last year.
These are current facts from official and industry sources. Any forecast beyond them is analysis.
Wheat Price Forecast and Outlook
The near-term wheat price forecast leans higher, but with wide uncertainty. Supportive factors are lower US output, smaller Black Sea exports, and slightly lower world stocks. USDA’s Economic Research Service reports that farm-level wheat prices were 35.1% higher in August 2026 than a year earlier. That figure covers US farm prices, not world export prices.
Offsetting factors include Australia’s upgraded crop and large Canadian carryover stocks. No single forecast is reliable, so treat any point estimate as a scenario. Weather, Black Sea logistics, and currency moves can shift the picture quickly.
Opportunities and Risks
Opportunity
- Market Diversification: Wheat buyers who are actively seeking alternative black sea suppliers can explore Canada, Australia, Argentina, and EU wheat exporters through shipment-level wheat trade data.
- Price Opportunities: Higher wheat prices can improve exporter revenue when shipment volumes remain strong, creating opportunities to identify competitive suppliers and profitable markets.
- Premium Wheat: Durum and premium-quality wheat offer higher-value opportunities, particularly for buyers tracking specialized wheat suppliers, product specifications, and destination-market demand.
Risks
- Geopolitical Disruption: Black Sea shipping restrictions, conflict, and changing trade routes can disrupt wheat supply, delivery schedules, and exporter reliability.
- Wheat production risk: Drought and adverse weather across major wheat-producing regions can reduce output, tighten wheat supply, and increase price volatility.
- Sanction Exposure: Sanctions affecting exporters, buyers, banks, or logistics networks can create compliance and transaction risks, making entity-level sanctions screening essential before trade decisions.
- Policy and Margin Risk: Export taxes, trade restrictions, and stronger currencies can reduce exporters’ margins and make suppliers less competitive in global wheat markets.
FAQs
Which country has the most wheat exports?
Russia was the leading wheat exporter in 2025, with exports valued at approximately $17.0 billion, strengthening its position among the world’s major wheat-exporting countries.
How much are Canada’s wheat exports forecast to be in 2026-2027?
Canada’s wheat exports are forecast at 28.5 million tonnes in 2026-2027, down 1.2 million tonnes from the previous year amid lower production expectations.
What is the HS code for wheat?
The main wheat HS Code is 1001, covering wheat and meslin, including durum wheat and other wheat categories used in international trade data.
Where can I find wheat trade data?
You can find detailed wheat trade data on Export Genius, including wheat exports, imports, shipment quantities, values, buyers, suppliers, and trading countries.
What is the difference between wheat production and wheat exports?
Wheat production represents the quantity grown within a country, while wheat exports represent the portion shipped internationally to buyers across global wheat markets.
Conclusion
Russia is the largest wheat exporter, Canada is a clear second, and world wheat export value has fallen about 21% since 2023. The 2026/27 season looks tighter, with lower projected trade and Black Sea disruption supporting prices.
See Trade Intelligence in Action
Get a personalized walkthrough of our trade intelligence platform and discover new buyers, markets, and opportunities.
Schedule a Demo →