
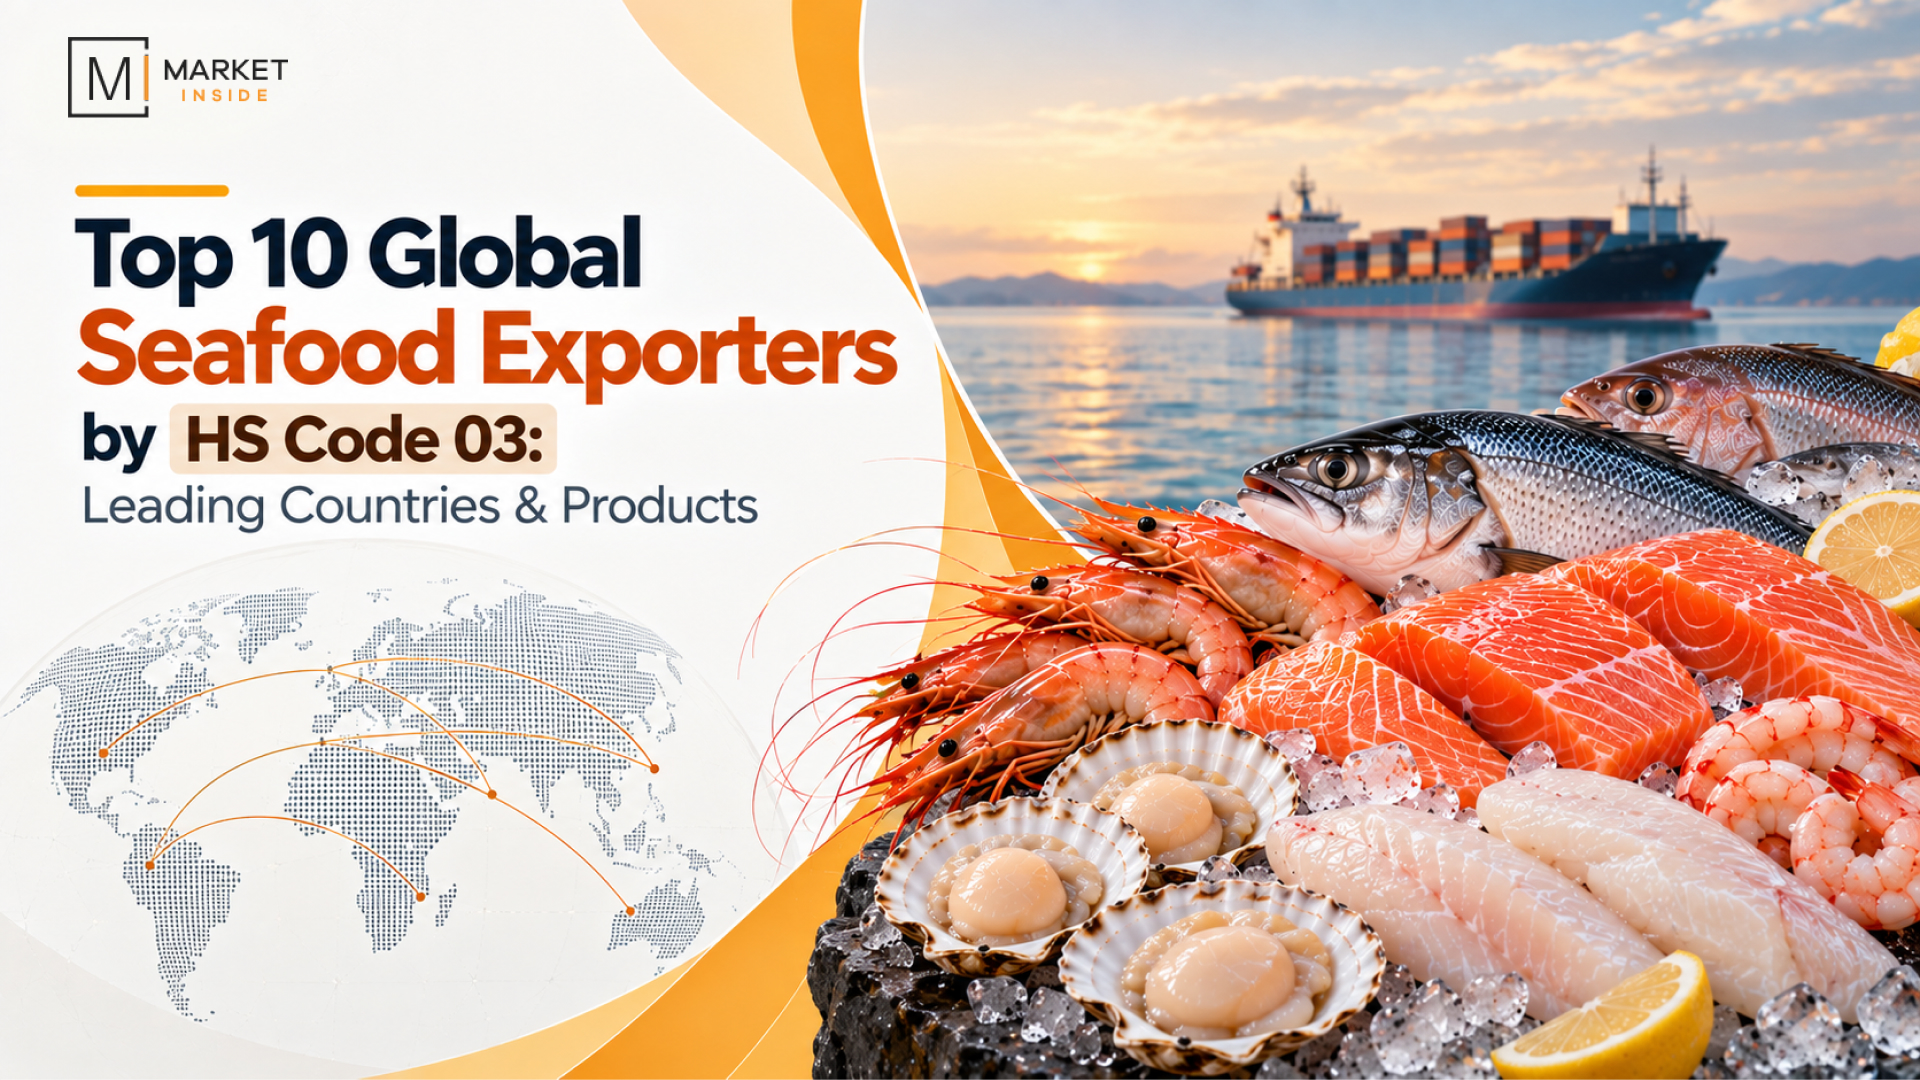
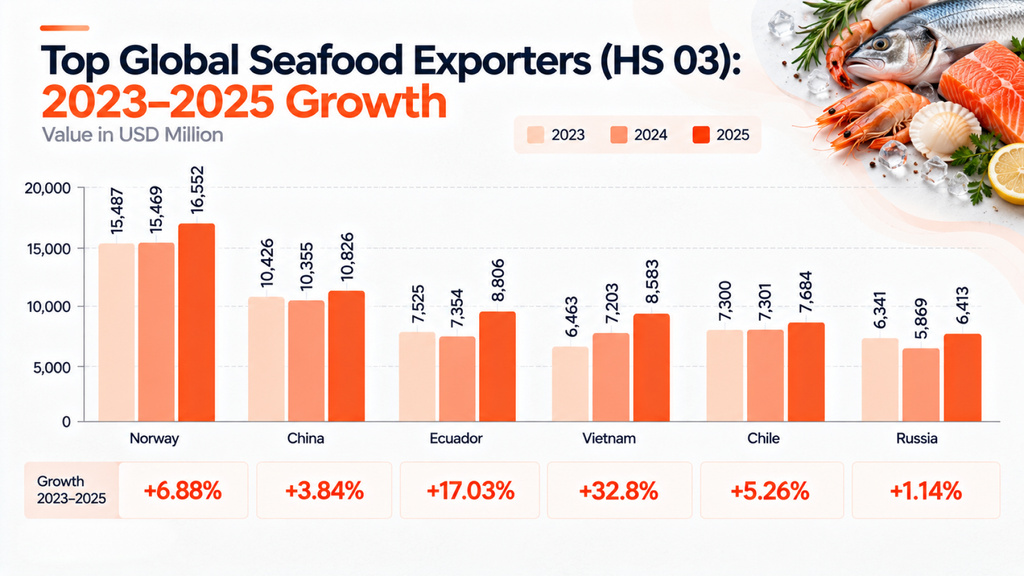
The global seafood and fish export market under HS code 03 increased to $150.94 billion in 2025, up 8.28% from 2023. Among the top seafood and fish exporters, Norway is the world’s largest seafood exporter overall ($16.55 billion), while seafood export rankings shift by product type: China leads live fish exports, Norway leads fresh/Chilled fish exports, Russia leads frozen fish, Chile leads fish fillet, and Poland leads dried, salted, and smoked fish.
What Counts as “Seafood” Under HS Code 03
In this globalised world, “seafood” isn’t one category – it’s Chapter 03 of the Harmonized System (HS), titled “Fish and Crustaceans, molluscs and other aquatic invertebrates.” Chapter 03 splits into subheadings based on how the fish is processed and preserved, not the species itself. This seafood and fish classification matters a lot commercially; a country can dominate one subheading while barely appearing in another.
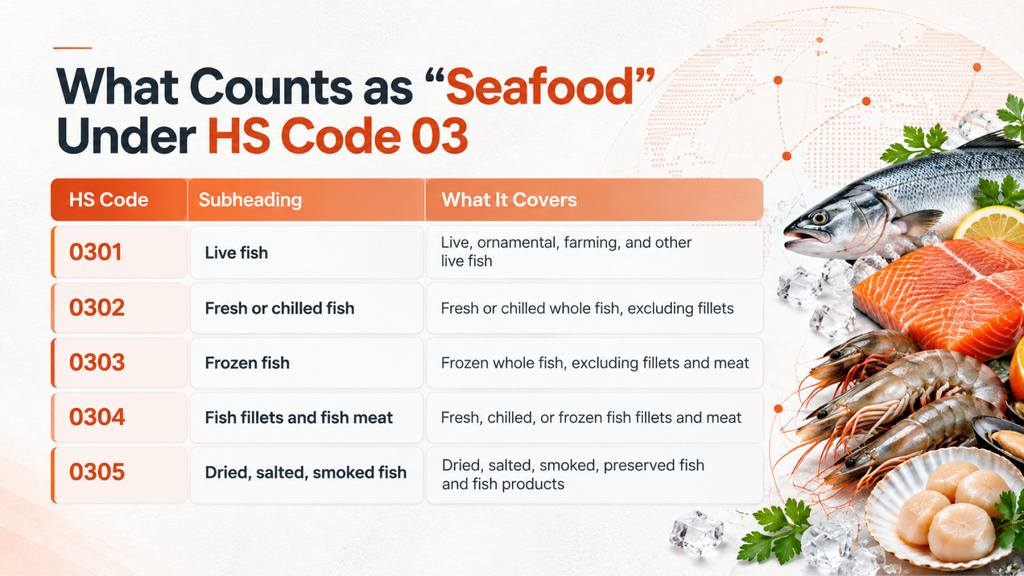
In international trade, this seafood and fish classification is widely known as the backbone of the rankings below — each table represents a seafood and fish market, which is why the “top seafood and fish exporters” drop from one HS code to the next.
Global Seafood Export Market Overview (HS 03)
The global seafood and fish export market is a major part of the food chain, with producers, exporters, importers, and consumers involved. Before categorizing seafood and fish products, let’s understand the overall seafood market, trade volumes, and the countries that control the seafood market.
| Top Seafood Exporters | 2023 | 2024 | 2025 | Growth 2023-2025 |
|---|---|---|---|---|
| World | 139,402 | 139,252 | 150,941 | +8.28% |
| Norway | 15,487 | 15,469 | 16,552 | +6.88% |
| China | 10,426 | 10,355 | 10,826 | +3.84% |
| Ecuador | 7,525 | 7,354 | 8,806 | +17.03% |
| Vietnam | 6,463 | 7,203 | 8,583 | +32.8% |
| Chile | 7,300 | 7,301 | 7,684 | +5.26% |
| Russia | 6,341 | 5,869 | 6,413 | +1.14% |
The continuously growing demand for seafood and the fish market achieved an 8.28% overall growth. Notably, Norway, a European country, dominates the seafood export market by a wide margin, while Ecuador is growing more than twice as fast as any other country in this list, a single point worth tracking as the seafood market rankings narrow into specific product types below.
- Norway leads global seafood exports at $16.55B, more than 50% ahead of China’s total seafood exports, which were $10.8 billion.
- Ecuador witnessed outstanding growth, up 17.03%, far outpacing Norway, China, and Chile. This indicates an emerging seafood and fish export market and new suppliers.
- Russia’s seafood and fish export market grew the slowest among the top seafood exporters, growing by just 1.14%, despite a mid 2024 dip.
- The total world seafood and fish export market rebounded strongly in 2025 after a flat 2024, suggesting demand recovery rather than steady linear growth.
This seafood and fish export market overview sets the baseline; now understand how seafood is split by HS subheading, and let’s start with the most specialised category – Live Fish
Top 10 Live Fish Exporters (HS Code 0301): Top Exporting Countries
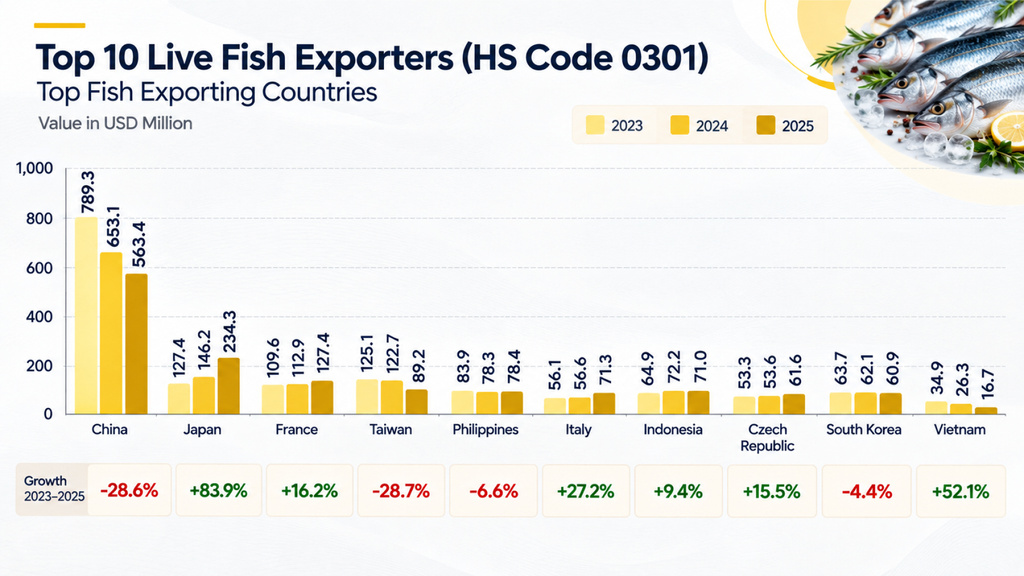
According to the fish export data, fish is the most intensive seafood category, since exporters must keep fish alive in transit. This makes and reflect country’s specialised cold-chain and aquaculture-export capability more than raw production scale. Here’s the breakdown:
- China’s live fish export more than the combined value of France and Japan, but China’s live fish exports experienced a decline of 28.6% since 2023. This dragged the entire global live fish category down 12.8%, whereas Japan and Vietnam expanded rapidly.
- Japan live fish exports overtook Taiwan for second place, growing 83.9%, witnessing the fastest growth among the top 10 live fish exporters.
- Vietnam’s live fish export market nearly doubled, with its 2024 value in a single year (+63.0%)
- Notably, China and Taiwan live fish export share almost identical percentage declines (-28.6 and – 28.7%), suggesting a shared regional pressure.
Live fish trade depends on specialised transport; the next category, fresh or chilled fish, follows a different logic built around speed-to-market rather than keeping the animal alive. Let’s understand the market and top exporters.
| Top Live Fish Exporters | 2023 | 2024 | 2025 | Growth 2023-2025 |
|---|---|---|---|---|
| World | 2,356.1 | 2,058.4 | 2,054.3 | -12.8% |
| China | 789.3 | 653.1 | 563.4 | -28.6% |
| Japan | 127.4 | 146.2 | 234.3 | +83.9% |
| France | 109.6 | 112.9 | 127.4 | +16.2% |
| Taiwan | 125.1 | 122.7 | 89.2 | -28.7% |
| Philippines | 83.9 | 78.3 | 78.4 | -6.6% |
| Italy | 56.1 | 56.6 | 71.3 | +27.2% |
| Indonesia | 64.9 | 72.2 | 71.0 | +9.4% |
| Czech Republic | 53.3 | 53.6 | 61.6 | +15.5% |
| South Korea | 63.7 | 62.1 | 60.9 | -4.4% |
| Vietnam | 34.9 | 26.3 | 16.7 | +52.1% |
Top 10 Fresh or Chilled Fish Exporters — HS 0302
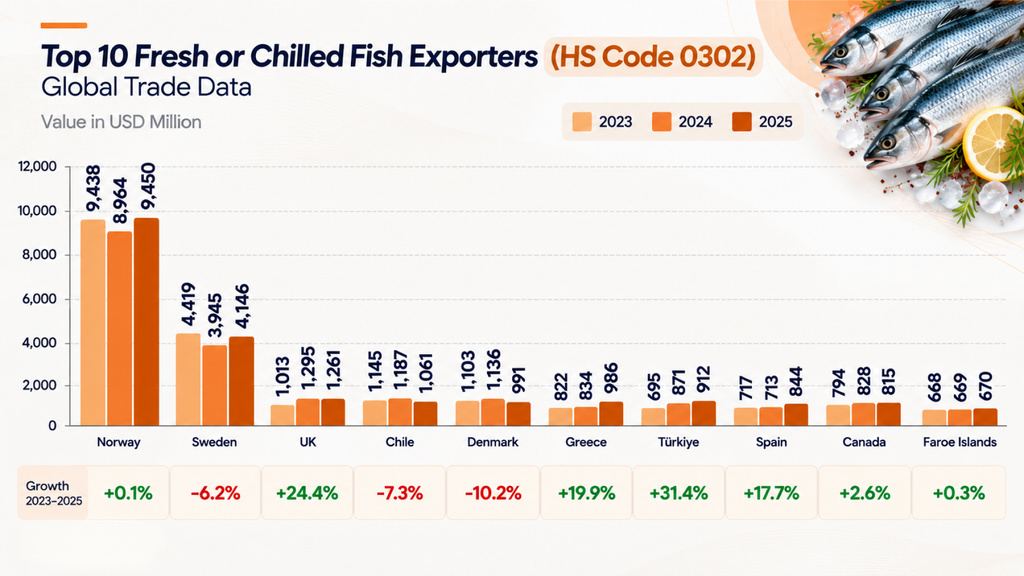
According to fish export data, fresh or chilled fish trade favours countries with strong domestic fishing fleets and proximity to major consumer markets, since the product must reach buyers quickly without freezing. In a highly competitive market, Norway holds a commanding position in the fresh or chilled fish export market, nearly double what Sweden exports; despite this, Turkey and the UK are the fastest-growing markets for fresh or chilled fish, expanding by double digits.
- Turkey’s geographical location makes it the fastest grower (+31.4%) for fresh and chilled fish, followed by the UK (+24.4%) and Greece (+19.9%).
- According to fresh or chilled exports, Denmark experienced the steepest decline (-10.2%), followed by Chile (-7.3%) and Sweden (-6.2%).
- Notably, Norway and Sweden together account for over 64% of the top 10 fresh or chilled fish exporters‘ combined value.
| Top Fresh or Chilled Fish Exporter | 2023 | 2024 | 2025 | Growth 2023-2025 |
|---|---|---|---|---|
| Norway | 9,438 | 8,964 | 9,450 | +0.1% |
| Sweden | 4,419 | 3,945 | 4,146 | -6.2% |
| UK | 1,013 | 1,295 | 1,261 | +24.4% |
| Chile | 1,145 | 1,187 | 1,061 | -7.3% |
| Denmark | 1,103 | 1,136 | 991 | -10.2% |
| Greece | 822 | 834 | 986 | +19.9% |
| Türkiye | 695 | 871 | 912 | +31.4% |
| Spain | 717 | 713 | 844 | +17.7% |
| Canada | 794 | 828 | 815 | +2.6% |
| Faroe Islands | 668 | 669 | 670 | +0.3% |
Fresh fish has a short shelf life by definition – freezing solves that constraint, which is exactly where the next category, frozen fish, becomes commercially important.
Frozen Fish Exporters — HS 0303
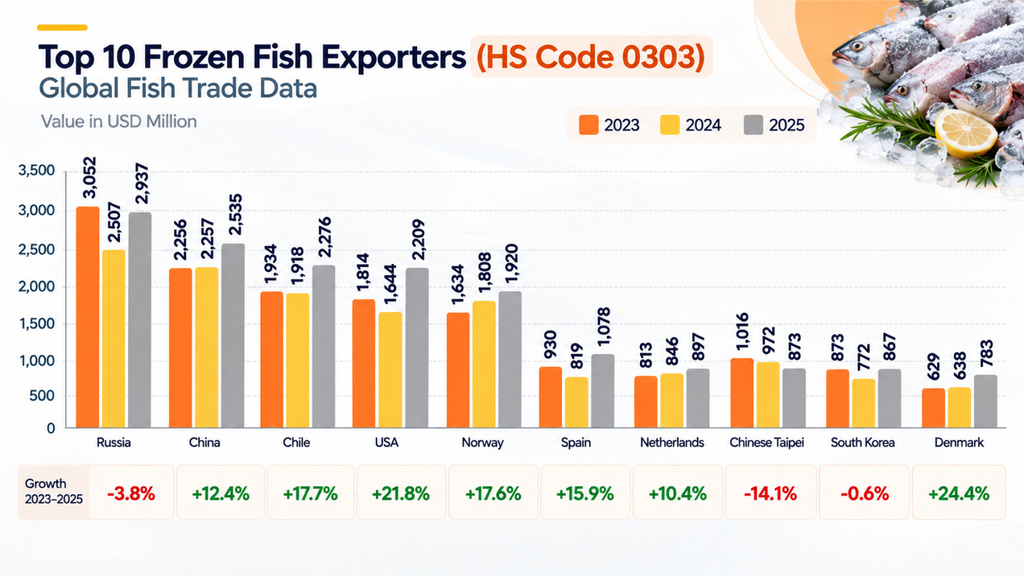
Freezing any edible items drastically increases the shelf life and enables long-distance trade. So, frozen fish becomes important in global trade to meet demand and supply. Let’s understand the frozen fish market, their suppliers, and export value. Russia leads frozen fish exports despite a 3.8% decline, while the
- USA and Denmark both witnessed growth above 21%, showing that the frozen segment rewards countries with large-scale processing and cold-storage infrastructure rather than just fishing volume.
- Taiwan, a most strategic country in the western Pacific Ocean, declined most sharply (-14.1%), the only country among the top frozen fish exporters.
- Notable: China’s frozen fish export is closed to Russia’s ( in terms of value), growing +12.4%, while Russia slipped -3.8%.
- Chile and Norway grew almost identically (+17.7% and +17.6%), reflecting parallel expansion in Southern and Northern Hemisphere frozen fish y.
| Frozen Fish Exporters | 2023 | 2024 | 2025 | Growth 2023 – 2025 |
|---|---|---|---|---|
| Russia | 3,052 | 2,507 | 2,937 | -3.8% |
| China | 2,256 | 2,257 | 2,535 | +12.4% |
| Chile | 1,934 | 1,918 | 2,276 | +17.7% |
| USA | 1,814 | 1,644 | 2,209 | +21.8% |
| Norway | 1,634 | 1,808 | 1,920 | +17.6% |
| Spain | 930 | 819 | 1,078 | +15.9% |
| Netherlands | 813 | 846 | 897 | +10.4% |
| Chinese Taipei | 1,016 | 972 | 873 | -14.1% |
| South Korea | 873 | 772 | 867 | -0.6% |
| Denmark | 629 | 638 | 783 | +24.4% |
Value USD Million
Frozen whole fish is only part of the story — many buyers want ready-to-cook cuts, which shifts focus to the next category: fish fillets. Here’s the breakdown
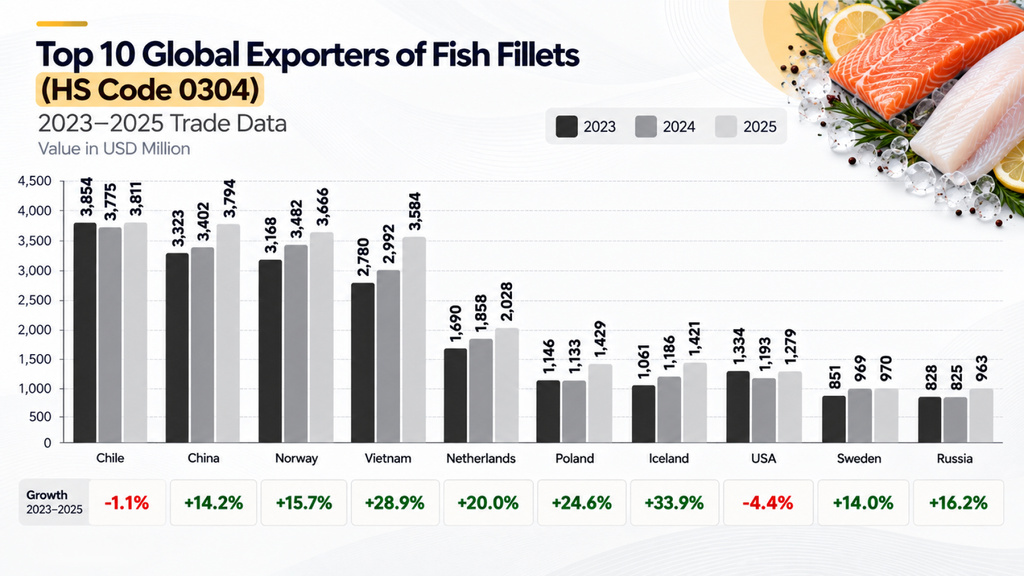
Top 10 Fish Fillet Exporters — HS 0304
Across the world, fish fillets represent higher-value, processed seafood, and this table includes the largest dollar values of any HS 03 subcategories reviewed — reflecting the added processing value built into the export price.
- According to the fish export data, Chile holds the top position in fish fillets for the last three consecutive years. However, its fish-fillets export market growth is flat.
- China and Norway are among the top competitors for Chile’s fish-fillets market, while Iceland posts the strongest percentage growth of any country in this entire report.
- Vietnam’s fish-fillet market is the only major grower (+28.9%) among the top performers.
- Poland and the Netherlands both grew over 20%, reinforcing a broader Northern European fillet-export expansion.
| Top 10 Fish Fillets Exporters | 2023 | 2024 | 2025 | Growth 2023-2025 |
|---|---|---|---|---|
| Chile | 3,854 | 3,775 | 3,811 | -1.1% |
| China | 3,323 | 3,402 | 3,794 | +14.2% |
| Norway | 3,168 | 3,482 | 3,666 | +15.7% |
| Vietnam | 2,780 | 2,992 | 3,584 | +28.9% |
| Netherlands | 1,690 | 1,858 | 2,028 | +20.0% |
| Poland | 1,146 | 1,133 | 1,429 | +24.6% |
| Iceland | 1,061 | 1,186 | 1,421 | +33.9% |
| USA | 1,334 | 1,193 | 1,279 | -4.4% |
| Sweden | 851 | 969 | 970 | +14.0% |
| Russia | 828 | 825 | 963 | +16.2% |
Not all seafood is sold fresh or frozen for cooking; preservation through drying, salting, and smoking remains a distinct, often overlooked export category, covered next.
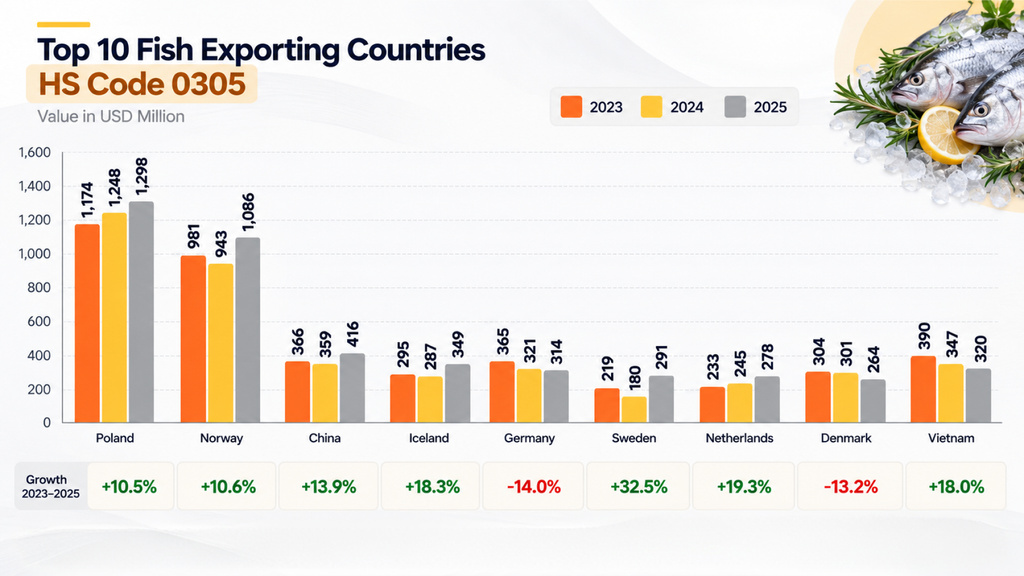
Top 10 Dried, Salted & Smoked Fish Exporters — HS 0305
This seafood category includes dried, salted, brined, or smoked fish, plus fish flour and meals; it is smaller by dollar value than the others, but shows some of the sharpest percentage swings in this report.
| Dried, Salted & Smoked Fish Exporters | 2023 | 2024 | 2025 | Growth 2023-2025 |
|---|---|---|---|---|
| Poland | 1,174 | 1,248 | 1,298 | +10.5% |
| Norway | 981 | 943 | 1,086 | +10.6% |
| China | 366 | 359 | 416 | +13.9% |
| Iceland | 295 | 287 | 349 | +18.3% |
| Germany | 365 | 321 | 314 | -14.0% |
| Sweden | 219 | 180 | 291 | +32.5% |
| Netherlands | 233 | 245 | 278 | +19.3% |
| Denmark | 304 | 301 | 264 | -13.2% |
| Vietnam | 390 | 347 | 320 | 18.0% |
- As per the seafood and fish export data, Poland and Norway lead this category (dried, salted, brined, or smoked fish) by a wide margin in the last three consecutive years. Swedens
- Sweden (+32.5%) and Vietnam (-32.5%), dried, salted, brined, or smoked fish moved in exactly opposite directions, a near-perfect inverse relationship.
- Poland and Norway together account for over 55% of the total export value among the top 10 exporters.
- Notably, Germany and Denmark, both markets, declined by double digits, the only two countries among the top 10.
- Iceland’s growth here (+18.3%) adds to its strong performance in fish fillets, making it one of the most consistent risers across categories.
Having moved through all five HS 03 subheadings – live, fresh, frozen, filleted, and preserved- the next section pulls these threads together into practical takeaways for buyers and suppliers.
What This Means for Buyers and Suppliers
- Match sourcing strategy to product category, not just country reputation. Norway is best for fresh/chilled fish and dried/smoked fish, but a small player for live fish and fillets – sourcing decisions need to be category-specific.
- Watch Iceland vs Vietnam. Iceland showed top-3 growth in two different categories (fillets and dried fish), while Vietnam shows the most divergent trend – strong growth in live fish but a steep decline in dried fish.
- China’s position is category by category. It is the leader in total seafood value, but it is losing market share in live fish and gaining in fillets and frozen fish – a sign of a shift in domestic processing strategy rather than a uniform decline.
- Diversify away from single-origin dependency, especially in categories such as fresh/chilled fish where Norway and Sweden together have over 60% share of top 10 trade value.
- Track percentage growth and absolute value. For example, a country like Iceland or Sweden may have the fastest growth rate in a category, but be much smaller in dollar terms than the leader. Both measures are important for different sourcing decisions.
FAQs
What is HS Code 03?
HS Code 03 is the Harmonized System chapter for fish and crustaceans, mollusks and other aquatic invertebrates – the standard customs classification used to track global seafood trade.
What is the difference between 0301, 0302, 0303, 0304, and 0305 HS?
Live fish are covered by 0301, fresh or chilled fish by 0302, frozen fish by 0303 fish filets and fish meat by 0304 , and dried , salted, brined, or smoked fish and fish meal by 030 .
Which country is the top overall seafood exporter?
Norway is the number one exporter for seafood (HS Chapter 03) overall with $16.55 billion in exports in 2025, followed by China and Ecuador.
Which seafood category is growing fastest?
Growth by category: Japan (+83.9%) topped the live fish, fresh/chilled fish (+31.4%) from Türkiye, frozen fish (+24.4%) by Denmark, filets (+33.9%) by Iceland, and dried fish (+32.5%) by Sweden.
Why does China rank differently across seafood categories?
China dominates total seafood value and frozen fish and fillet growth, but live fish exports have slumped 28.6% since 2023, showing different dynamics by processing type rather than a consistent pattern.
How is seafood export growth calculated?
Growth is measured as ((New Value – Old Value) / Old Value) * 100 and compares export values in two years, such as 2023 and 2025.
Is world fish trade growing or shrinking?
Despite declines in individual subcategories such as live fish, overall HS Chapter 03 seafood trade grew 8.28% from 2023 to 2025 to reach $150.94 billion.
Which countries are consistently high exporters of seafood by category?
Among the top performers in several HS 03 subcategories are China, Norway, and Iceland, although their rank and growth rate differ considerably depending on the type of product.
Conclusion
The seafood trade is not one market, but five different markets, each with its own leaders and momentum. Norway anchors the broadest measure of seafood trade, but drill into any single HS 03 subheading and the leaderboard changes: China leads live fish, Russia leads frozen fish, Chile leads fillets, Poland leads dried and smoked fish. The fastest-growing players — Japan, Vietnam, Iceland, Türkiye and Sweden — aren’t always the biggest, but they’re the ones changing category rankings the most. The real opportunity for buyers, suppliers and market entrants is to align their sourcing decisions with the specific HS code that matters for their business, not the entire seafood sector.
Looking to compare sourcing options for live, fresh, frozen, filleted or preserved seafood? Use the category-specific rankings above to benchmark suppliers before committing to a single origin.
See Trade Intelligence in Action
Get a personalized walkthrough of our trade intelligence platform and discover new buyers, markets, and opportunities.
Schedule a Demo →