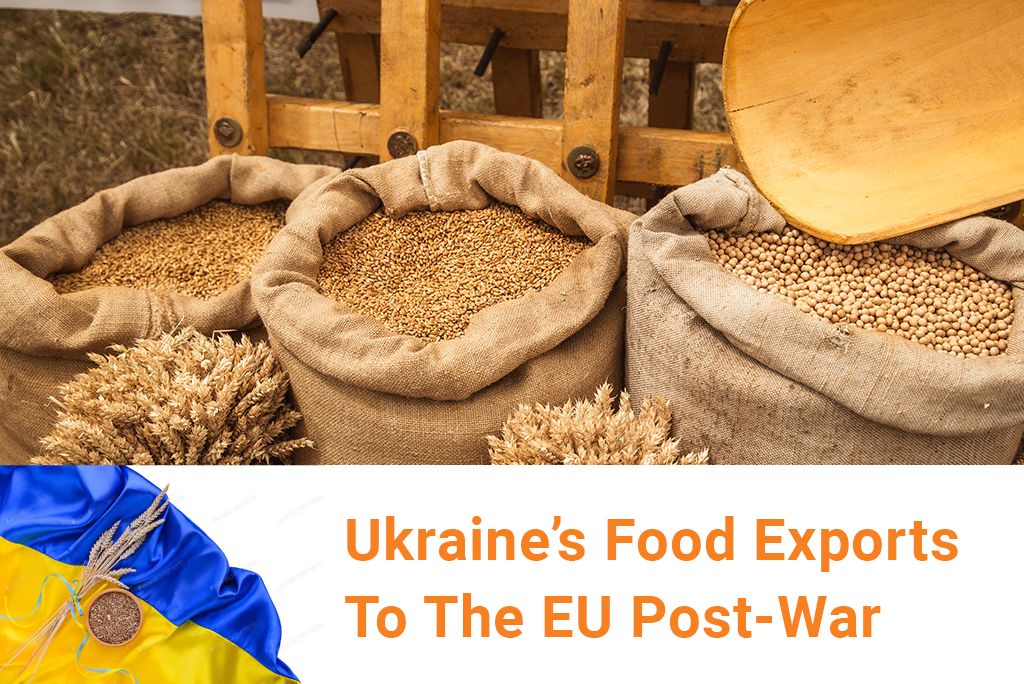
Ukraine’s food exports to the EU have declined in the post-war period, specifically in the immediate aftermath of the Russia-Ukraine war, which started out in February this year. Following the first quarter of 2022, the second quarter registered a significant downfall. Since the Russian invasion of Ukraine in February 2022, food security in several countries has lessened, while the prices of food inflation have soared. Developed nations such as the EU, US, and UK have turned their attention to restricting Russian items, so the only hope is Ukraine. Ukraine’s Food Exports Ukraine’s contribution to the world’s food market accounts for 10% of the world’s wheat, 15% of the world’s corn, 13% of the world’s barley, and more than 50% of
The EU has been progressing towards creating a transition from the traditional usage of fossil fuels to alternative and clean energy. The efforts come, especially from the aftermath of the Russia-Ukraine crisis that started in February 2022. Imports for clean and alternative energy in the EU were registered to be slightly higher than exports. A few commodities included in the representation of the comparison data between the imports and exports are—solar panels, biodiesel, and wind turbines. EU Clean Energy – Product 1: Solar Panels The first product featured in the EU clean energy imports is solar panels (Subheading 854140). From the comparison between the values of both imports and exports, we can see that the values of imports are already
The European Union (EU) is going through a phase of soaring energy prices as a result of the Russian invasion of Ukraine. The high energy prices in the EU have influenced the authorities to devise measures to go into a self-reliant mode to meet domestic demand. The members of the European Union are proposing a ban on the importation of Russian crude products following the 5 of December. Along with the ban on importing crude oil from Russia, the price cap on the importation of gas is also being discussed among the European Commission as a political agreement. Russian Crude Exports – Region Wise Russia’s crude oil exports to top regions in the world are represented in Russian export data
EU-Indonesia to develop ties this year, so much so that the EU imports from Indonesia have surged by a value difference of about $3 billion. The EU is likely to import much higher than Indonesia’s import in the near time, as per the analysis of trade data of both countries. The imports of the EU from Indonesia are relatively higher than the imports of Indonesia. This shows that both countries, especially the European Union, are moving towards the progression of the previous talks over the Comprehensive Economic Partnership Agreement (CEPA) from 2016. EU-Indonesia Historical Trade The first data shown below shows the yearly imports of the EU from Indonesia. 2017 shows the total value of imports amounting to $19.4 billion,
Russia produces about 4% of the world’s iron and steel, following China at the top, with nearly half of the world’s iron and steel produced by the Southeast Asian country. In 2020, Russia was the fourth-largest steel producer and hence, Russian iron & steel exports were in the top 5. In 2022, the Russian Federation increased its crude steel production as compared to the production in 2020. The production of Russia’s iron and steel (Chapter 72) and exports reached their historically highest value in 2021 and so does the values of exports to Mexico peaked high. Russia’s Iron and Steel Demand Russian iron and steel production in 2021 reached a slightly better level compared to the preceding year. In 2021,
Japan’s semiconductor manufacturing will be finding a slight boost this year as the exports of the manufacturing materials of semiconductor is rising. The semiconductor exports as an end product are expected to grow if semiconductor manufacturing will grow in the near time. The semiconductor exports as compared to the semiconductor manufacturing industry output in Japan are at a bit lower levels. Nonetheless, the semiconductor exports will increase further as the semiconductor manufacturing materials will reach the countries manufacturing them. Tracing Exports Trend of Materials So Far The exports of semiconductor manufacturing materials from Japan are expected to grow as the representation of the semiconductor exports shows the second quarter of 2022 amounted to $236.61 million, up by 0.53% from the
Brazil’s soybean exports are the highest ever recorded in 2022 with a whopping value of $19 billion. This is the highest ‘quarterly’ value registered by Brazil in years, with soybean exports accounting for an upward trend by the second quarter of 2022. The USA and Brazil are the top producers of soybean, with a contribution of over 60% of the whole world’s soybean production. This year, while soybean farming ploughing good results and exports, the farming industry in the US for soybean is affected and as a result, exports too. Soybean Production In The US and Brazil The production of soybean in the US and Brazil were in close war as the values almost nearing each other for both countries.
Russia-UK trade values show a decline in the imports of the UK for 2021 as compared to 2020. The revelation of the trade of Russia with other countries shows contrary parallels, as the UK is the only exceptional country among all the top exporting partners of Russia. There might be several reasons why the trade of the UK declined in the year 2021—the time period when values were skyrocketing. Given that the UK is in the top 5 exporting countries of Russia, this comes as a surprisingly enough state of affairs between both countries. Russia Historical Trade The representation of Russia’s yearly exports will provide us with a glimpse into the trend of whether the exports of Russia increase or
Brazil is the world’s biggest coffee-producing country and fulfils about 40% of the demand by supplies to other countries. Brazil’s coffee exports are the highest in the world since it produces one-third of the coffee made in other countries. The total amount of coffee produced in Brazil for 2021 represents a drop as per different sources. Yet the value of exports for Brazilian coffee didn’t seem to decline. Even in a pandemic-struck world, the exports only grew and are expected to grow further. Brazilian Coffee Exports (2017-2021) Brazil’s coffee exports historical data represented below features the number of exports Brazil made in the past five years. In 2012, the exports amounted to $5.7 billion, followed by $4.5 billion and $6