

Indonesia is among the major Southeast Asian economies with abundant natural resources, diverse industries, and a strategic location connecting global markets. Its key sectors include agriculture, mining, energy, and manufacturing, contributing to its growing role in international trade.
Indonesia’s export data for 2026 paints a picture of an economy still dominated by certain commodities such as coal, nickel, derivatives, and palm oil. But there’s a lot of headway being made in metals and manufactured goods. Indonesia’s export data for Q1 and Q2 2026 and a three-year view from 2023 to 2025 show leading products and markets for Indonesia’s trade performance and those markets that are losing out. This article reviews Indonesia’s leading export commodities by volume and value, leading export destinations, and rates of growth.
Indonesia Export Data: Q2 2026
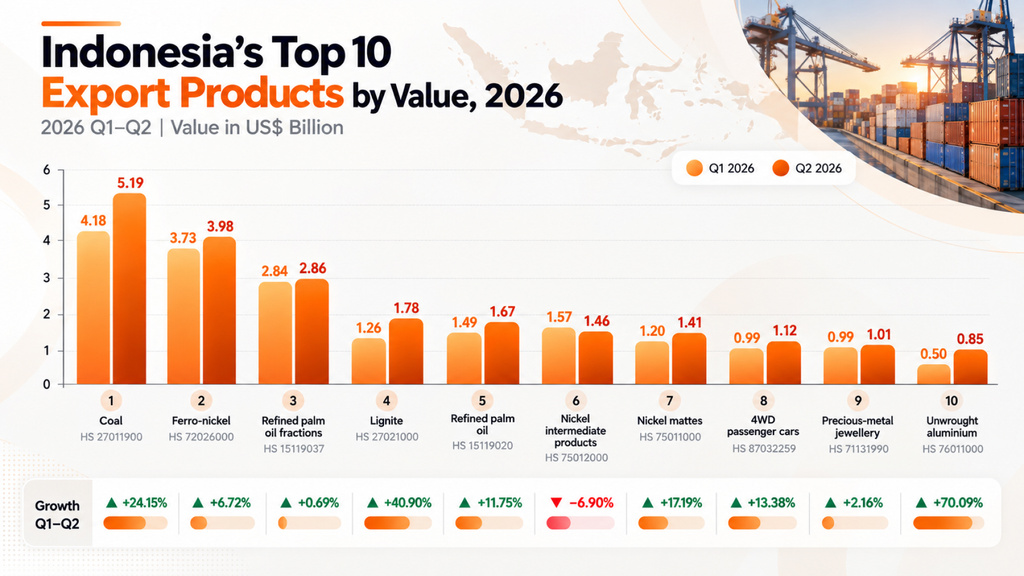
Indonesia’s largest export product by value in Q2 2026 was coal, worth US$5.19 billion, followed by ferro-nickel at US$3.98 billion and refined palm oil fractions at US$2.86 billion. For export destinations, China ranked first with US$18.45 billion, ahead of the United States at US$8.55 billion.
What Are Indonesia’s Top 10 Export Products by Value in 2026?
Over the years, Indonesia’s export economy has spanned multiple sectors, connecting domestic industries with international markets. To understand which products contribute most to its export earnings. Let’s understand which products contribute most to its export earnings. The table below ranks Indonesia’s top 10 export products by value in 2026, highlighting their importance in the country’s global trade.
Key Insights
- According to Indonesia export data, nine of the ten indonesia export products witnessed growth btwee Q1-Q2. Only nickel intermediate product export slipped by 6.90%.
- Indonesia’s export market was driven by coal exports at US$5.19 billion in Q2, well ahead of ferro-nickel at US$3.98 billion, showing that Indonesia’s export earnings still follow energy-commodity demand more than any manufactured category.
- Coal, lignite, Nickel and its products, and palm oil make up seven of the top 10 Indonesian export products, so a tariff, quota or price change in a single chain can reshuffle the whole Indonesian export market.
- Aluminium (+70,09%) and Lignite (+40.90%) grew fastest, but aluminium’s Q1 value of 0.5 was the slowest growth among Indonesia’s top exported products.
- Notably, in Indonesia’s export basket, ferro-nickel (+6.72%) and nickel mattes (+17.19%) rose while nickel intermediate product export fell by 6.90%. “NIckle” is not a trade, and buyers should track each HS code separately.
- Among Indonesia’s top export products, 4WD passenger cars (+13.38) and precious metals jewellery(+2.16%) show manufactured exports near US$1 billion a quarter, a smaller but less commodity-driven segment for buyers diversifying away from raw materials.
| Rank | HS Code | Indonesia Export Product | Q1 2026 (US$ Bn) | Q2 2026 (US$ Bn) | Growth |
|---|---|---|---|---|---|
| 1 | 27011900 | Coal | 4.18 | 5.19 | +24.15% |
| 2 | 72026000 | Ferro-nickel | 3.73 | 3.98 | +6.72% |
| 3 | 15119037 | Refined palm oil fractions | 2.84 | 2.86 | +0.69% |
| 4 | 27021000 | Lignite | 1.26 | 1.78 | +40.90% |
| 5 | 15119020 | Refined palm oil | 1.49 | 1.67 | +11.75% |
| 6 | 75012000 | Nickel intermediate products | 1.57 | 1.46 | −6.90% |
| 7 | 75011000 | Nickel mattes | 1.2 | 1.41 | +17.19% |
| 8 | 87032259 | 4WD passenger cars | 0.99 | 1.12 | +13.38% |
| 9 | 71131990 | Precious-metal jewellery | 0.99 | 1.01 | +2.16% |
| 10 | 76011000 | Unwrought aluminium | 0.5 | 0.85 | +70.09% |
After analysing Indonesia export data for the top 10 exported products, we see increases across key products, but shipment volumes tell a different story. Are higher earnings coming from more exports or higher prices? The Indonesia export quantity data reveals where volumes are growing, where they are shrinking, and what buyers should do next.
Indonesia’s Top 10 Export Products by Quantity, 2026
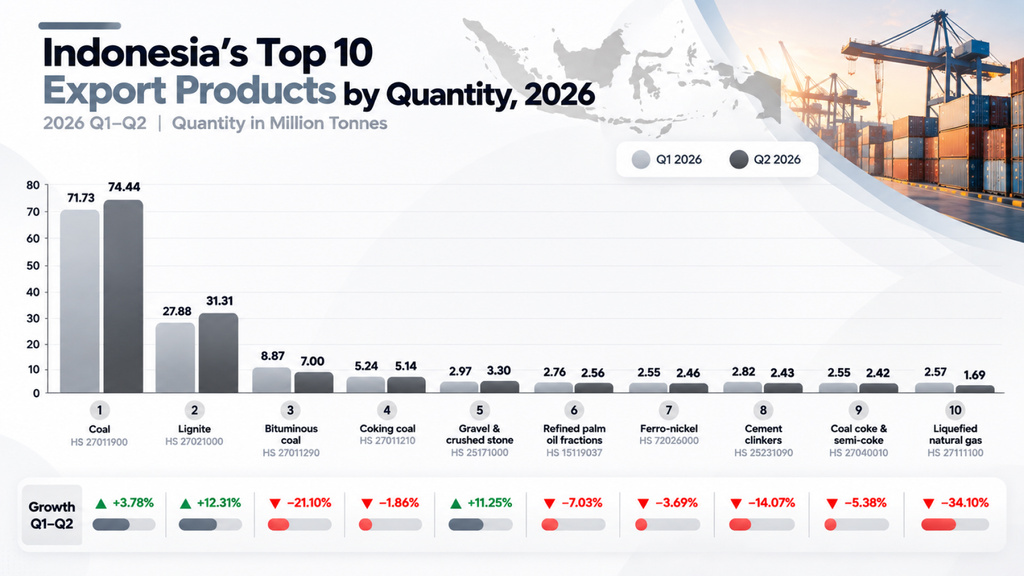
Indonesia’s export products by value can be complex. A product can earn more because buyers shipped more, or because each ton sold for a higher price. The table below on Indonesia’s top 10 export products by quantity highlights volume-driven growth versus price-driven growth, which helps in deciding whether a market is expanding or merely getting more expensive.
- Indonesia’s export products highlight that five of the ten export product volumes are coal-related (coal, lignite, bituminous, coking coal, coke). This makes Indonesia’s export footprint more fuel-heavy than the exports by value.
- Coal export value grew 24.15% while tonnes grew 3.78%; lignite value grew 40.90% against 12.31 in tonnes. Indonesia export value outpacing volume is consistent with higher prices per tonne.
- Bituminous coal growth dropped (-21.10%), and coking (1.86%) fell while coal (HS 27011900) and lignite rose, so volume growth is concentrated in the broader thermal-coals segment rather than the specialty grades.
- Indonesia Ferro-nickel export value rose 6.72% on 3.69% fewer tonnes, and refined palm oil fraction held value (0.69+) on 7.03 fewer tonnes. Buyers paid more per tonne for the same products.
| Rank | HS Code | Indonesia Top Export Products | Q1 2026 (Mn Tonnes) | Q2 2026 (Mn Tonnes) | Growth |
|---|---|---|---|---|---|
| 1 | 27011900 | Coal | 71.73 | 74.44 | +3.78% |
| 2 | 27021000 | Lignite | 27.88 | 31.31 | +12.31% |
| 3 | 27011290 | Bituminous coal | 8.87 | 7 | −21.10% |
| 4 | 27011210 | Coking coal | 5.24 | 5.14 | −1.86% |
| 5 | 25171000 | Gravel & crushed stone | 2.97 | 3.3 | +11.25% |
| 6 | 15119037 | Refined palm oil fractions | 2.76 | 2.56 | −7.03% |
| 7 | 72026000 | Ferro-nickel | 2.55 | 2.46 | −3.69% |
| 8 | 25231090 | Cement clinkers | 2.82 | 2.43 | −14.07% |
| 9 | 27040010 | Coal coke & semi-coke | 2.55 | 2.42 | −5.38% |
| 10 | 27111100 | Liquefied natural gas | 2.57 | 1.69 | −34.10% |
Indonesia’s export data highlights what the country sells and how volumes are traded — but which countries are paying the most for these exports? Let’s take a look at Indonesia’s top export markets by value, showing where its trade earnings are concentrated and where buyers may find emerging opportunities.
Indonesia’s Top 10 Export Markets by Value, Q1–Q2 2026
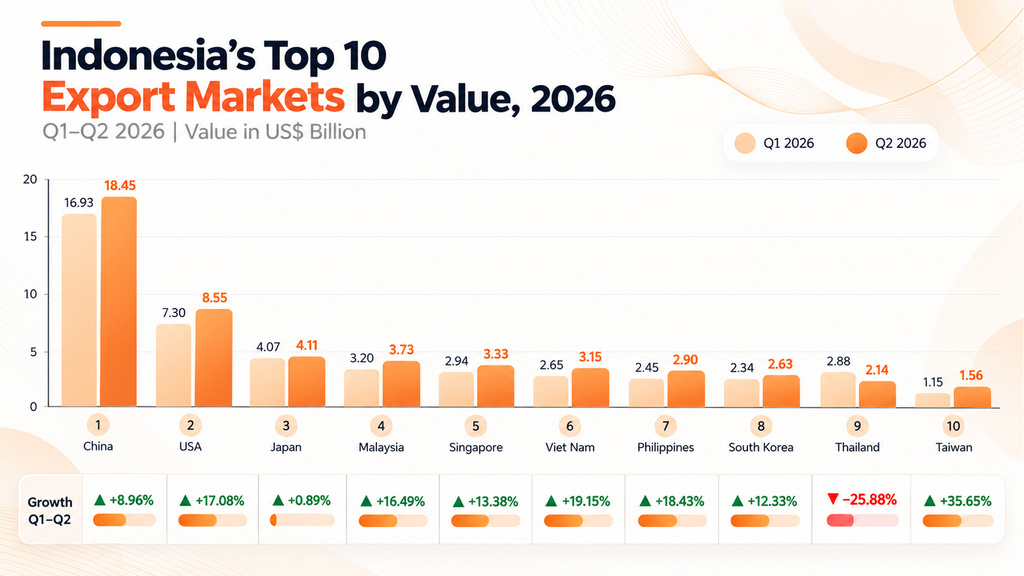
Indonesia’s export products by value and volume present only half of the trade picture. Where Indonesia’s export cargo lands determines which buyers matter, which logistics lanes are busy, and which trade policies carry the most risk. The table below highlights Indonesia’s top 10 export markets by value for Q1 and Q2 2026. Look at the table below to answer: how concentrated is demand, which market is accelerating, and which are slipping?
- Indonesia export data shows that China is a major and crucial market for Indonesia’s exports. China imported goods worth US$ 18.45 billion in Q2, which is far ahead of all other top export destinations. A single shift in Chinese demand or purchasing policies can significantly affect Indonesia’s overall export performance.
- Notably, nine of the Indonesian export markets grew from Q1 to Q2, highlighting that the improvement came from general demand and prices, not a single buyer.
- Vietnam (+19.15%), the Philippines (+18.43%), Malaysia (16.49%), and Singapore (+13.38%) all grew by double digits, pointing to rising regional demand for Indonesian goods.
- US imports from Indonesia grew 17.08% in Q2, whereas Indonesia exports to Thailand decreased by 25.88% in the same period.
| Indonesia’s Top Export Market | Q1 2026 (US$ Bn) | Q2 2026 (US$ Bn) | Growth |
|---|---|---|---|
| China | 16.93 | 18.45 | +8.96% |
| USA | 7.3 | 8.55 | +17.08% |
| Japan | 4.07 | 4.11 | +0.89% |
| Malaysia | 3.2 | 3.73 | +16.49% |
| Singapore | 2.94 | 3.33 | +13.38% |
| Viet Nam | 2.65 | 3.15 | +19.15% |
| Philippines | 2.45 | 2.9 | +18.43% |
| South Korea | 2.34 | 2.63 | +12.33% |
| Thailand | 2.88 | 2.14 | −25.88% |
| Taiwan | 1.15 | 1.56 | %35.65% |
Indonesia export data from Q1-Q2 shows where Indonesia’s exports are concentrated, with China leading and several Southeast Asian markets gaining momentum. But is this growth part of a lasting trend or a short-term shift? The 2023-2025 data reveals how Indonesia’s export markets have evolved over time.
Indonesia’s Top 10 Export Markets by Value, 2023–2025
Indonesia’s quarterly export movements show momentum, but only a longer series shows structure. The table below tracks Indonesia’s top 10 export markets across three full years, 2023-2025. This helps distinguish markets that are growing steadily from those that are recovering, fading, or simply volatile.
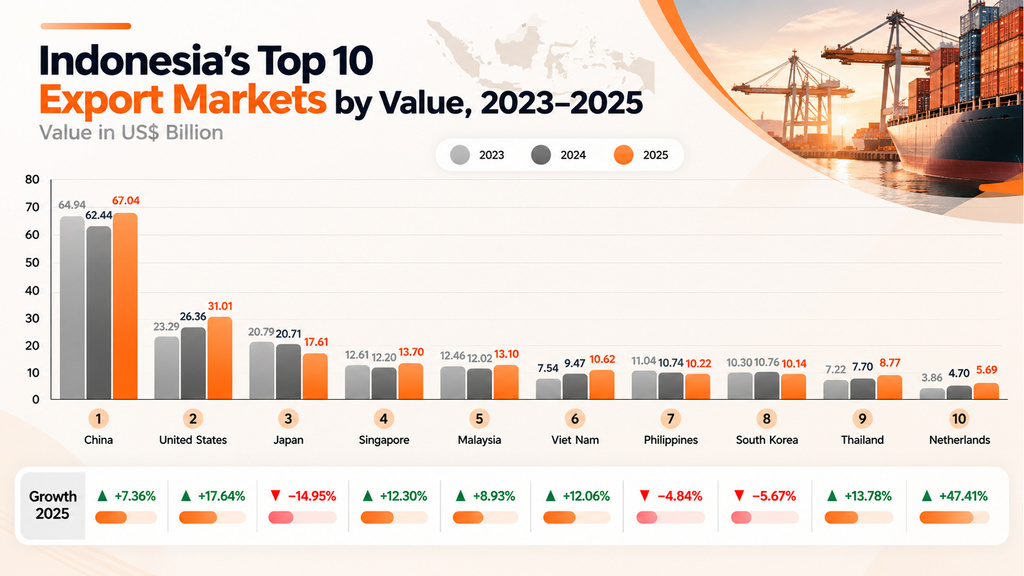
| Indonesia’s Top Export Market | 2023 (US$ Bn) | 2024 (US$ Bn) | 2025 (US$ Bn) | Growth 2025 |
|---|---|---|---|---|
| China | 64.94 | 62.44 | 67.04 | +7.36% |
| United States | 23.29 | 26.36 | 31.01 | +17.64% |
| Japan | 20.79 | 20.71 | 17.61 | −14.95% |
| Singapore | 12.61 | 12.2 | 13.7 | +12.30% |
| Malaysia | 12.46 | 12.02 | 13.1 | +8.93% |
| Viet Nam | 7.54 | 9.47 | 10.62 | +12.06% |
| Philippines | 11.04 | 10.74 | 10.22 | −4.84% |
| South Korea | 10.3 | 10.76 | 10.14 | −5.67% |
| Thailand | 7.22 | 7.7 | 8.77 | +13.78% |
| Netherlands | 3.86 | 4.70 | 5.69 | +47.41% |
What the Data Shows
China stayed first throughout, dipping to US$62.44 billion in 2024 before reaching US$67.04 billion in 2025, the highest of the three years. The United States is the clearest structural gainer, rising from US$23.29 billion to US$31.01 billion. Japan moved the other way: it was near US$20 billion in 2023 and 2024, then fell in 2025. Three markets rose in every year of the series: the United States, Viet Nam and Thailand.
- According to Indonesia export data, China imported US$67.04 billion in 2025, exceeding the US ($31.01 billion), so Indonesia’s export strategy is, in practice, a China strategy with secondary markets around it.
- The United States posted positive growth in all years from 2023 to 2025 and recorded the fastest growth in 2025 among the top 10 Indonesian export destinations at +17.64%, making it the most reliable high-volume growth market.
- According to Indonesia export data, Japan saw the steepest decline, -14.95%, in 2025, showing the United States pulling away from Japan.
- Vietnam imports rose from $7.54 to $10.62 billion over three years, and Singapore, Malaysia, and Thailand all grew in 2025, supporting regional demand.
How can businesses use trade data to expand Business globally?
Indonesia export data, Indonesia trade data, and Indonesia import data help businesses find potential markets, identify potential buyers, and understand competition before investing in international expansion. By analysing HS Codes, shipment volumes, trade values, and buyer activity, companies can make more informed decisions.
How to Find the Right Export Markets?
- Start searching for products by name and HS Code to see which countries import similar goods.
- Compare import values, volumes, shipment records, and recent trends to identify markets with active or growing demand.
- Shortlist destinations that match your product, pricing, production capacity, and shipping capability.
- Consider multiple markets to reduce dependence on a single destination.
How to identify potential international buyers?
- Use global buyer data to find companies importing products like yours
- Filter results by product, HS Code, country, and shipment date.
- Check shipment frequency and order size to prioritize buyers that fit your supply capacity.
- Screen companies against the global sanctions list; investigate potential matches using current official records before proceeding with business partners.
Understand Competition and Plan Market Entry
- Review supplier countries and companies already serving your targeted market.
- Compare shipment patterns to understand how established the competition is.
- Use trade activity to inform your pricing, product positioning, and delivery plans.
For Indonesian exporters, Indonesia export data can help assess overseas demand for coal, palm oil, nickel products, aluminium, vehicles, and jewellery. Businesses can use HS Code searches and shipment records to build a shortlist of markets and potential buyers, then verify each opportunity through direct research.
Frequently Asked Questions
What is Indonesia’s largest export product?
Coal was Indonesia’s largest export product by value in Q2 2026, generating US$5.19 billion in export earnings and recording shipments of 74.44 million tonnes.
What are Indonesia’s main export products?
Indonesia’s top export products include coal, ferro-nickel, refined palm oil, lignite, nickel intermediates, nickel mattes, passenger cars, precious-metal jewellery and unwrought aluminium.
Which country imports the most from Indonesia?
China was Indonesia’s largest export market in Q2 2026, importing goods worth US$18.45 billion, ahead of the United States and Japan.
Which Indonesian export product grew the fastest in 2026?
Unwrought aluminium recorded the fastest value growth among Indonesia’s top 10 export products, rising 70.09% from US$0.50 billion in Q1 to US$0.85 billion in Q2 2026.
Which Indonesian export market grew the fastest in 2026?
Viet Nam recorded the fastest growth among Indonesia’s top 10 export markets, with imports from Indonesia increasing 19.15%, from US$2.65 billion in Q1 to US$3.15 billion in Q2 2026.
Is Indonesia a major palm oil exporter?
Yes. Palm oil is a major Indonesian export commodity. Refined palm oil and refined palm oil fractions featured among the country’s top 10 export products by value in Q1–Q2 2026.
Conclusion
Indonesia’s export profile combines large-scale commodity shipments with a growing base of processed minerals, food products and manufactured goods. According to Indonesia export data for 2026, coal remains the dominant export by value and quantity, while aluminium, lignite, nickel matte and passenger cars recorded strong growth.
For companies, the most attractive opportunities are concentrated in energy commodities, palm-oil derivatives, nickel processing, aluminium, automotive products, and Southeast Asian trade corridors. China remains Indonesia’s largest export market, but the United States and ASEAN destinations are becoming increasingly important sources of growth.
See Trade Intelligence in Action
Get a personalized walkthrough of our trade intelligence platform and discover new buyers, markets, and opportunities.
Schedule a Demo →