

For years. The United States of America has been at the heart of Canada’s trade. But recent developments under the Trump administration and new tariffs are pushing Canada to diversify, using its strategic location and strong partnerships to reach more global markets.
Canada shipped $557.1 billion worth of goods to the world in 2025; this number seems like paed a number until you notice what’s happening to it. Canada exports 2026 data reveals a country in the middle of a structural pivot: its exports to the United States are falling, exports to the United Kingdom have nearly quadrupled in three years, and China has gone from a shrinking partner to Canada’s fastest-growing major market. For any business tracking global trade data, whether you’re sourcing crude oil, gold, potash, or auto parts, this structural shift in international trade matters more than the headline total.
This article breaks down Canada’s exports, top 10 export partners, and top 10 export products.
What Are Canada’s Top Exports and Partners in 2026?
According to Canada export data, Canada’s largest exports by value are crude oil and unwrought gold; together, these are worth over $38 billion in Q2 2026 alone. The United States remains Canada’s top export destination at $402.2 billion in 2025, though that figure fell 8.33% over two years. Meanwhile, canada export to the UK surged 217.72% to $33.3 billion, and Canada’s exports to China grew 8.09% to $24.4 billion, evidence that Canadian exporters are actively diversifying away from US dependence.
Market Overview: A Trade Relationship in Transition
Canadian exports totaled $557.1 billion in 2025, down 2.13% from $569.2 billion in 2024. Imports went the other way, up 1.73 per cent to $563.8 billion, meaning Canada’s merchandise trade balance moved into deficit territory for the year. It looks like a soft year on the face of it. But dig deeper, and the story is really about where trade is taking place, not just how much.
- Canadian merchandise trade has been on an upward trend for multiple years, but exports dropped -2.13% in 2025 after flatlining in 2024.
- The value of imports rose 1.73 percent from the same period, narrowing Canada’s trade surplus and indicating robust domestic demand.
- The divergence between falling exports and rising imports is a sign of weaker external demand, mostly related to US tariff pressure on Canadian goods.
- For procurement teams, the rise in imports indicates that Canadian buyers are aggressively sourcing more from foreign suppliers, despite trade tensions.
- This change set the stage for the partner-level realignment shown in the next table.
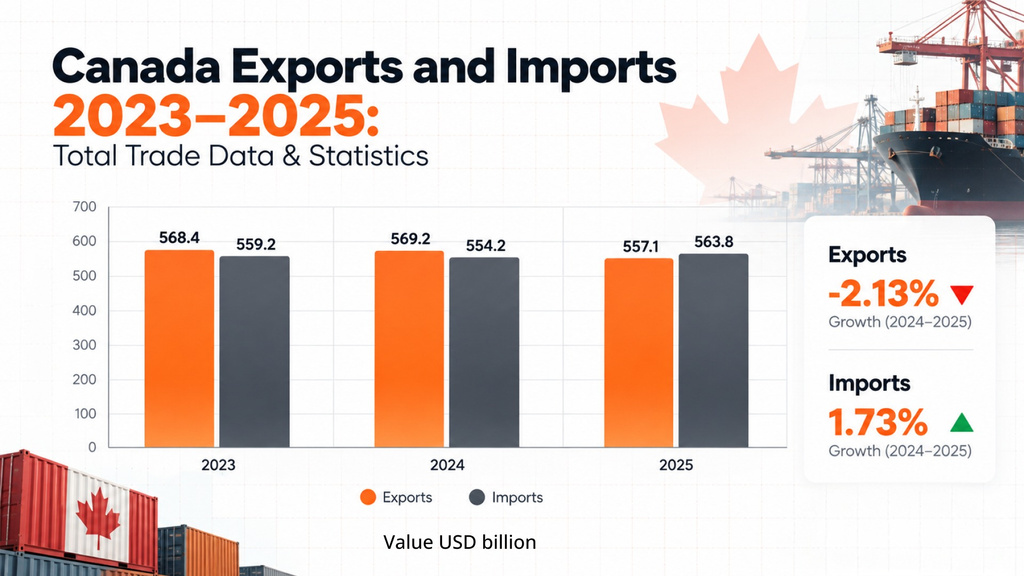
| Canada Total Export-Import | 2023 | 2024 | 2025 | Growth 2024–2025 |
| Exports ($B) | 568.4 | 569.2 | 557.1 | -2.13% |
| Imports ($B) | 559.2 | 554.2 | 563.8 | +1.73% |
Not all trade relationships shared in this general decline equally. The real story of 2025 is a shift in the distribution of Canadian exports from a single dominant buyer to a broader set of markets, as the next table shows.
Canada’s Top 10 Export Partners: Where the Trade Is Moving
The table below presents Canada’s 10 largest export destinations by value for 2023-2025, along with the growth rate for each wzotvh over that period. This is the clearest evidence yet that Canadian exporters are actively shifting their customer base.
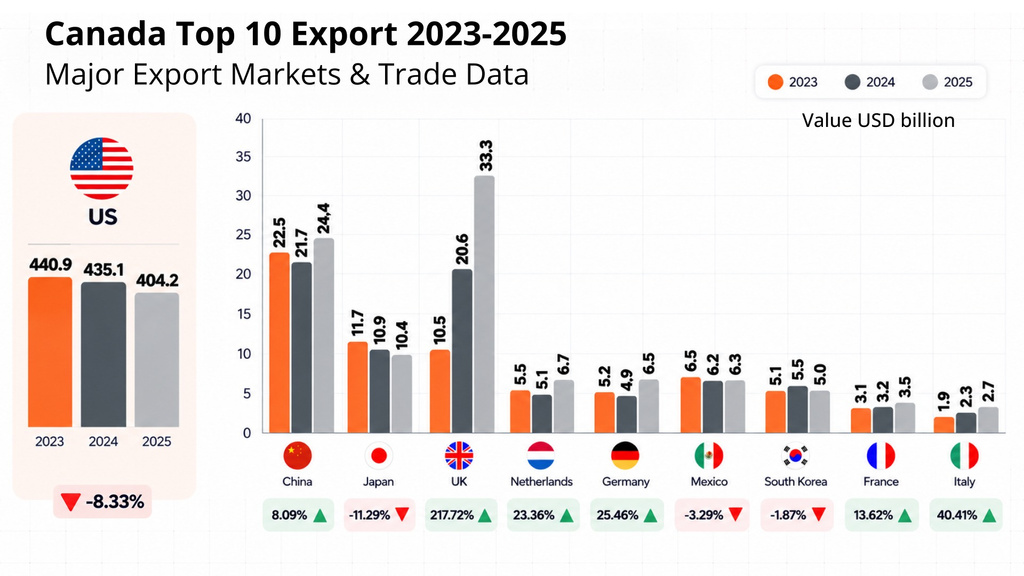
| Canada Top Export Partners | 2023 ($B) | 2024 ($B) | 2025 ($B) | Growth 2023–2025 |
| US | 440.9 | 435.1 | 404.2 | -8.33% |
| China | 22.5 | 21.7 | 24.4 | +8.09% |
| Japan | 11.7 | 10.9 | 10.4 | -11.29% |
| UK | 10.5 | 20.6 | 33.3 | +217.72% |
| Netherlands | 5.5 | 5.1 | 6.7 | +23.36% |
| Germany | 5.2 | 4.9 | 6.5 | +25.46% |
| Mexico | 6.5 | 6.2 | 6.3 | -3.29% |
| South Korea | 5.1 | 5.5 | 5.0 | -1.87% |
| France | 3.1 | 3.2 | 3.5 | +13.62% |
| Italy | 1.9 | 2.3 | 2.7 | +40.41% |
Key takeaways:
- The US still absorbs over 70% of Canadian exports but declined 8.33% since 2023, its steepest sustained drop in recent memory.
- Exports to the UK soared 217.72%, fueled by a surge in gold shipments, making Britain Canada’s best growth market.
- China slipped back in 2024 but then rebounded 8.09%, aided by warmer relations and higher demand for canola, energy and minerals.
- European buyers – Germany, Netherlands, Italy, France – all saw double-digit or near double-digit growth, indicating purposeful diversification.
- Japan and South Korea also declined, indicating exporters may require new strategies to defend share in East Asian markets.
And then the story gets even more specific when you look at what is actually crossing those borders. For example, a rise in UK exports of this magnitude is not spread evenly across the economy – it is concentrated in a few product categories, as the next table shows.
Canada’s Top 10 Export Products: What’s Driving the Numbers
This table tracks Canada’s ten highest-value export products by HS code, comparing Q1 2026 against Q2 2026 to show near-term momentum at the product level.
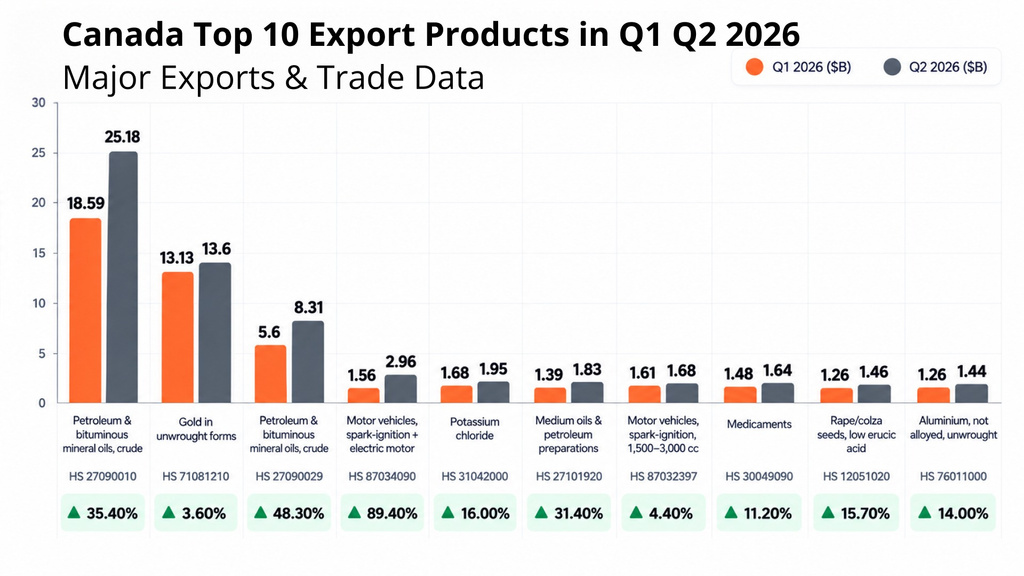
| HS Code | Product | Q1 2026 ($B) | Q2 2026 ($B) | Growth |
| 27090010 | Petroleum & bituminous mineral oils, crude | 18.59 | 25.18 | +35.40% |
| 71081210 | Gold in unwrought forms | 13.13 | 13.6 | +3.60% |
| 27090029 | Petroleum & bituminous mineral oils, crude | 5.6 | 8.31 | +48.30% |
| 87034090 | Motor vehicles, spark-ignition + electric motor | 1.56 | 2.96 | +89.40% |
| 31042000 | Potassium chloride | 1.68 | 1.95 | +16.00% |
| 27101920 | Medium oils & petroleum preparations | 1.39 | 1.83 | +31.40% |
| 87032397 | Motor vehicles, spark-ignition, 1,500–3,000cc | 1.61 | 1.68 | +4.40% |
| 30049090 | Medicaments | 1.48 | 1.64 | +11.20% |
| 12051020 | Rape/colza seeds, low erucic acid | 1.26 | 1.46 | +15.70% |
| 76011000 | Aluminium, not alloyed, unwrought | 1.26 | 1.44 | +14.00% |
Crude petroleum is the leading commodity, with 2 separate crude oil categories together worth over $33 billion in Q2 2026, growing 35-48% quarter-on-quarter.
- Unwrought gold maintained its #2 position with steady 3.6% growth, consistent with its role in fueling the UK export surge.
- Exports of hybrid and electric-motor vehicles had the biggest jump of any product, up 89.40%, suggesting a fast-growing EV export category.
- Potash (potassium chloride) was up 16%, supported by ongoing global fertilizer demand from agricultural buyers
- All top 10 products posted quarter-over-quarter growth, showing broad-based momentum despite a decline in full-year export totals.
All three tables tell a consistent story taken as a whole: aggregate exports eased, but under that headline, energy, gold, and vehicles are carrying more weight, and the customer base is shifting hard toward the UK, China, and continental Europe.
Key Trade Trends Shaping Canada Exports 2026
The tables are connected by a few threads that explain the “why” behind the numbers.
Gold is not only diversifying markets, but it’s also driving the UK relationship. Statistics Canada’s monthly releases through mid-2026 repeatedly cite unwrought gold, silver, and platinum group metal shipments to the UK as a leading driver of export gains, with volumes rising alongside record gold prices.
Energy continues to be Canada’s biggest export category, but it’s a volatile one. The impact of developments in the Middle East conflict on global oil prices resulted in swings in crude oil prices between double-digit gains and steep monthly losses through 2026. This is the reason for the outsized 35-48% quarterly growth in the product table above.
Canada Trade Developments in 2026
April 2026 — U.S. Tariffs Pressure Key Sectors
U.S. trade restrictions were already weighing on several Canadian export sectors. By February, lumber exports were around 20% below their 2024 average, while steel exports had also fallen significantly. Government measures, including the Buy Canadian Policy, helped support domestic production.
July 1, 2026 — CUSMA Review Creates New Uncertainty
The first mandatory CUSMA joint review ended without agreement on a 16-year extension. Canada and Mexico supported extending the agreement, while the United States did not agree. CUSMA remains in force until 2036 but has entered an annual review process, creating additional uncertainty for North American supply chains.
August 4, 2026 — Canadian Exports Reach Record High
Canada’s merchandise exports reached C$77.5 billion in June. Exports of gold, silver and platinum-group metals rose 27.9%, while motor-vehicle and parts exports also increased. Higher precious-metal shipments, particularly gold to the United Kingdom, contributed to the growth.
August 25, 2026 — Canada Announces New Counter-Tariffs
Canada announced new tariffs on specified U.S. goods, effective September 8, with rates of 15%, 25% and 50%. Duties on certain U.S. steel and aluminum products increased to 50%. Ottawa also announced a C$7.5 billion package of support measures for affected workers and businesses.
September 14, 2026 — Exports to China Surge
Canadian exports to China rose 30.1% year over year to C$21.74 billion in the first half of 2026. Energy and minerals were major contributors, while imports from China declined 5.8%.
What the Timeline Shows
Canada faced pressure in several sectors from U.S. trade restrictions while exports to selected non-U.S. markets strengthened. However, the data do not establish that Canada’s August counter-tariffs caused the earlier weakness in U.S.-bound exports.
Business Opportunities From Canada’s 2026 Trade Data
For companies that are following this shift, the trade data suggests some specific opportunities.
UK-based suppliers and logistics providers stand to benefit from continued growth in gold, silver and platinum shipments, a relationship that has grown for five straight quarters. Buyers of crude oil, potash or medium petroleum products can use the above product level growth rates to time procurement around the Canadian supply cycle.
Manufacturers in the EV and hybrid vehicle supply chain should note the 89.40% quarter-on-quarter jump in Canadian vehicle exports — a category still small in absolute terms but scaling fast. Businesses currently dependent on US-Canada trade lanes in steel, aluminum, autos, or lumber should diversify sourcing or distribution given the sustained tariff pressure and the unresolved CUSMA annual review process.
How Trade Data Helps Businesses Make Better Decisions
Granular trade intelligence — to the HS code and quarterly level, as shown above — enables procurement and business-development teams to identify which countries are buying more of a particular product, which suppliers are picking up share in a given market, and where demand is shifting before it shows up in headline GDP numbers. For exporters, this means finding markets like the UK or Germany early, not after competitors have already established buyer relationships. For importers and procurement teams, it means monitoring supplier concentration risk – for example, realizing that over 70% of Canada’s exports still go to one country, the US, despite three years of steady decline.
Frequently Asked Questions
What was Canada’s total export value in 2025?
Canada exported $557.1 billion in goods in 2025, down 2.13% from $569.2 billion in 2024, according to the uploaded trade data.
Which country buys the most from Canada?
The United States remains Canada’s top export market at $404.2 billion in 2025, though this figure has declined 8.33% since 2023 due to tariff pressure.
Why did Canada’s exports to the UK grow so fast?
UK-bound exports rose 217.72% from 2023 to 2025, reaching $33.3 billion, driven primarily by a sustained surge in unwrought gold, silver, and platinum group metal shipments.
What is Canada’s top export product?
Crude petroleum and bituminous mineral oils (HS code 27090010) are Canada’s single largest export product, reaching $25.18 billion in Q2 2026 alone.
Is Canada’s trade with China growing or shrinking?
Growing. Exports to China rose 8.09% from 2023 to 2025 to $24.4 billion, and separate research found a 30.1% jump in the first half of 2026 alone.
How have US tariffs affected Canadian exports?
US tariffs on steel, aluminum, autos, and lumber have contributed to an 8.33% decline in Canada’s exports to the US since 2023, with sectors like lumber running roughly 20% below 2024 levels by early 2026.
What is CUSMA and how does the 2026 review affect trade?
CUSMA is the Canada-US-Mexico trade agreement. Its first mandatory joint review concluded July 1, 2026, without full renewal; the deal remains in force, but ongoing annual reviews add uncertainty for cross-border exporters.
What products should importers watch from Canada in 2026?
Crude oil, unwrought gold, potassium chloride, motor vehicles, and medicaments are Canada’s fastest-growing top-10 export products by quarterly value, per Q1–Q2 2026 data.
Conclusion
Canada’s 2026 export data tells a story of redirection rather than decline. Total export value dipped, but that headline masks a deliberate shift toward the UK, China, and continental Europe, powered by gold, energy, and a fast-scaling vehicle export segment — even as tariffs and an unresolved CUSMA review keep pressure on the traditional US relationship. For exporters, importers, and procurement teams, the underlying trade data offers a roadmap: diversify where growth is already happening, and hedge exposure where it isn’t.
Unlock China Trade Intelligence
Access verified import-export shipment data, discover trusted buyers and suppliers, and make confident sourcing decisions using real-time trade intelligence.
Request Demo →