


Have you ever thought about a scenario where two strategic partners conflict with each other in the trade arena? Where one country is a king of the Indian Ocean and the other holds a strategic location and plays an important role in ensuring the free flow of international trade of Export-Import.
The Countries are India and Maldives, for some reason, these countries have alarmed the world about a potential decline in trade across the world.
Despite the potential decline in trade, this blog will the business opportunities.
India and Maldives – A strategic partner
India is the 5th largest economy in the world in terms of GDP and the 3rd largest in terms of purchasing power parity (PPP). In contrast, Maldives is a group of small islands, and crossed more than 500 million dollars in trade with India, along with a currency swap agreement between RBI (Reserve Bank of India) and the monetary authority of Maldives to ease the flow of Import-Export of goods.
According to the Economic Complexity Index (2021), India ranks 14th and 11th in Export and Import respectively, and Maldives ranks the bottom.
India-Maldives conflict – A reason for concern
The diplomatic relations between India and Maldives start deteriorating with a political shift under the Maldives president’s policies and disparaging remarks by their minister against the Indian prime minister. This conflict was further ignited by a picture of the Indian Prime minister on social media promoting Lakshadweep as a tourist hub. This whole scenario resulted in the cancellation of the Maldives trip by thousands of Indians.
Impact on India-Maldives trade
Tourism – The Maldives economy is heavily dependent on foreign tourists to run its economy, and the major sources of tourists are from India. Ongoing conflict allows the Indian island Lakshadweep to represent itself as a tourist hub for both domestic and international tourists.
Bilateral trade – More than $500 million worth of trade will be impacted including drug and pharmaceutical, cement, agriculture and many more. India’s imports from the Maldives primarily comprise scrap metals.
At the same time, Indian exports to the Maldives include a variety of goods like engineering and industrial products, drugs and pharmaceuticals, cement and agricultural produce etc.
Let’s understand the trade value by the given data from the year 2020-2023.

| Year | Total Export Value in Million Dollars |
| 2020 | 243.8 |
| 2021 | 303.3 |
| 2022 | 641.7 |
| 2023 | 651.4 |
The following mention table presents the overall trade data from the year 2020-2023. In 2022, the trade value has doubled. To understand this, let’s try to explore the trade value of commodities between India and Maldives.

| Year | Iron and Steel | Mineral Fuels and Oils | Nuclear, Boilers, Machinery, etc. |
| 2020 | 5.9 | 1.4 | 13.2 |
| 2021 | 13.4 | 4.5 | 29.2 |
| 2022 | 76.4 | 21.6 | 73 |
| 2023 | 51 | 90.6 | 70.1 |
*****Trade Value Per Million Dollars
It’s very clear from the above table that trade value has seen an upward movement since 2022. Before 2022, the exchange of goods was below $20M for most of the traded commodities. However, the move taken by the government to strengthen the partnership resulted in double-digit growth for mentioned commodities.
Unfortunately, with the growing tension, this million-dollar trade is in the pendulum, opening the door for the US and the EU.
You may have heard the concept that the loss of someone is the profit of someone. This concept is well suited to the current position of the India-Maldives conflict. Let’s learn.
An appeal to promote Lakshadweep Island for domestic tourism by Indian Prime Minister, Mr Modi, opened the sector for both domestic and foreign investment
However, the potential threat to ban Indian Pharmaceutical drugs by the Maldives may result in higher costs for acquiring the same drug, which may be 100-200 times higher than Indian drugs. For instance, the Cost of an Asthma inhaler from the US-$380, EU-$180, China-$40 and India is at $2.
To enter the market, companies have to make their pharmaceutical products affordable. Apart from the Pharmaceutical sector, there are numerous sectors for growth.
Amid conflict – An opportunity for the US and Europe to export
Tourism is not only related to visiting a place, but it also includes various things like infrastructure (Hotels, villas, construction of roads, rail, highways etc.), cement, clothes, handicraft items and many more things for the overall development of the sector.
Before entering any business, a company needs a proper investigation into the launched product, the connectivity of the country with the rest of the world, annual traffic etc. What if all information is provided on a single platform? To get it, visit our Export Genius platform and find what you need for your business with all trade-related data.
Let’s learn how US and EU businesses will be served with golden opportunities for trade-related growth.
US Export to World
The US is a crucial player in international trade as a global economic powerhouse. The trade of value is sometimes more than some country’s GDP. In 2023, US exports to the world stood at $1685 B which is continuously growing since 2020. Look at the given table.

| Year | Value in Billion Dollars |
| 2020 | 1424.93 |
| 2021 | 1754.30 |
| 2022 | 2062.93 |
| 2023 (Till Oct) | 1685.64 |
Mineral fuels and oils are the most traded commodities and registered a more than 100% growth from 2020 to 2022. Not only this segment but other products export also increased. Data related to various commodities have been mentioned below.
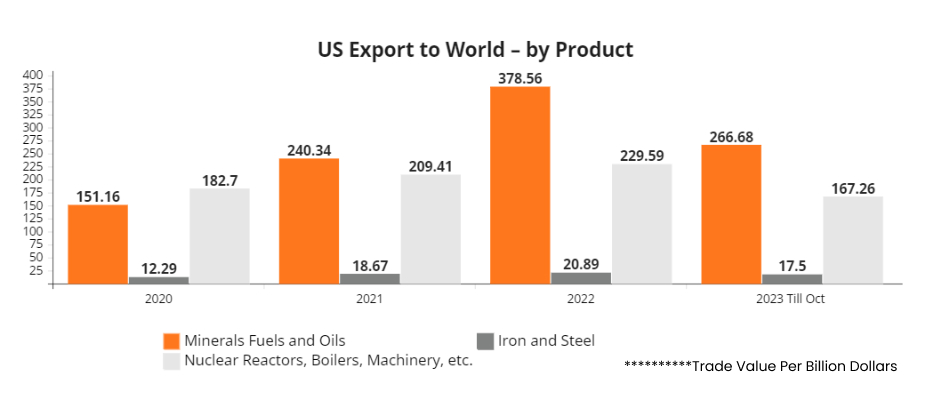
| Products Name | 2020 | 2021 | 2022 | 2023 Till Oct |
| Minerals Fuels and Oils | 151.16 | 240.34 | 378.56 | 266.68 |
| Iron and Steel | 12.29 | 18.67 | 20.89 | 17.50 |
| Nuclear Reactors, Boilers, Machinery, etc. | 182.70 | 209.41 | 229.59 | 167.26 |
**********Trade Value Per Billion Dollars
Europe – The Largest Trading Block
The EU is the largest trading bloc in the world with the connective economic power of its member countries. The trade value of this bloc achieved a milestone in 2022 with $8871 billion, a massive jump in trade value from 2020. The data mentioned in the below table present insight into the view of exports from the EU.
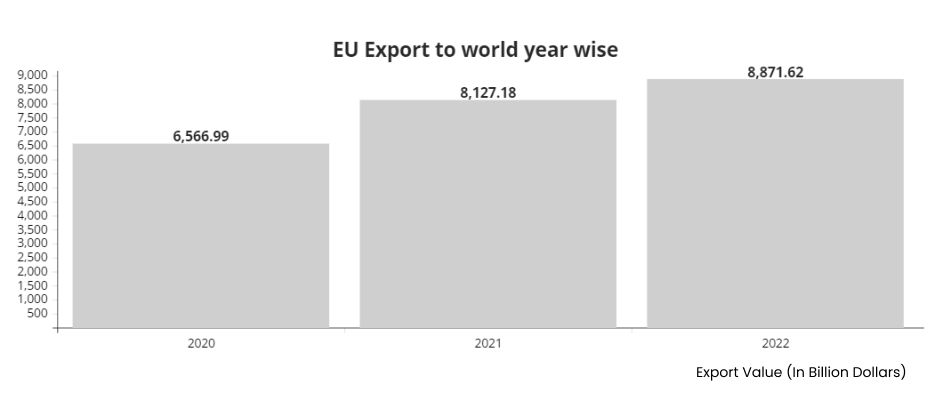
| Year | Export Value (In Billion Dollars) |
| 2020 | 6566.99 |
| 2021 | 8127.18 |
| 2022 | 8871.62 |
Apart from total exports of the EU to the World. let’s discuss the export commodities of the EU, for instance, nuclear reactors, boilers etc. are the most traded commodity with $946.29 billion in 2022, and the trade value of Minerals and fuels in 2022 stood at $1276.52 billion. Detailed data on export trade are mentioned below.
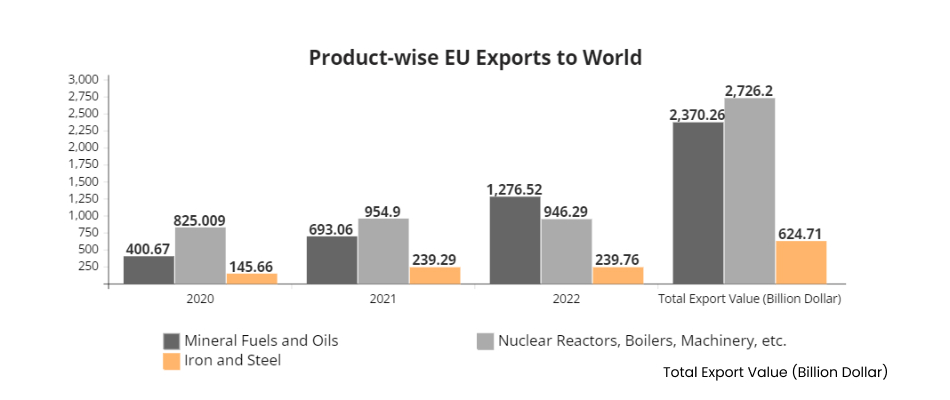
| Products Name | 2020 | 2021 | 2022 | Total Export Value (Billion Dollar) |
| Mineral Fuels and Oils | 400.67 | 693.06 | 1276.52 | 2370.26 |
| Nuclear Reactors, Boilers, Machinery, etc. | 825.009 | 954.90 | 946.29 | 2726.20 |
| Iron and Steel | 145.66 | 239.29 | 239.76 | 624.71 |
Despite India-Maldives conflicts, opportunities for doing business lie with those who are adaptable and risk evaluators. By navigating these factors, businesses can ensure sustainability in their operations.

